


The Nasdaq Recently Hit Correction Territory. Here's What History Says Comes Next.
Key Points
The Nasdaq-100 recently fell into correction territory by falling roughly 11% from its high.
Historically, stocks have fully recovered from every correction and bear market.
If you remain invested and continue with periodic investments, your returns can improve over time.
- 10 stocks we like better than Invesco QQQ Trust ›
Several days ago, the Nasdaq-100 index officially touched correction territory. On July 29, it closed just over 11% below its all-time high reached in early June.
For those worried about the implications of this pullback for their portfolios, it's important to remember that these kinds of drawdowns aren't unusual. The index was down more than 10% at the end of March this year. It nearly fell 20% in the first half of 2025 when the Trump administration imposed the "Liberation Day" tariffs. Another pullback occurred during the summer of 2024.
Missed Nvidia in 2009? This Rare Signal Is Flashing Again. In 2009, a "Double Down" signal flashed for a little-known chipmaker called Nvidia. For the first time in years, that same "Total Conviction" signal is flashing for a company 1/100th the size of Nvidia. Continue »
Corrections are normal and healthy (even though they can feel painful). But there are things you can do to help:
- Avoid the temptation to time the market. Studies have shown that investors usually lag the market when they try to get in and out.
- Continue automatic investments. Buying stocks throughout downturns can help lower your average purchase price and improve returns over time.
- Stay diversified. Try not to make significant asset allocation changes, such as moving everything to cash, during a correction.
- Revisit your risk tolerance. If a 10% pullback makes you uneasy, it might be time to consider a more conservative long-term asset allocation.
If those ideas aren't helping you feel any better, maybe this one will.
Image source: Getty Images.
History says that corrections have a 100% recovery rate
Around two months ago, the Nasdaq-100 index and the Invesco QQQ ETF (NASDAQ: QQQ), which tracks it, were trading at an all-time high. That means that the index has historically been able to come back from every dip, correction, bear market, and total meltdown it has ever experienced.
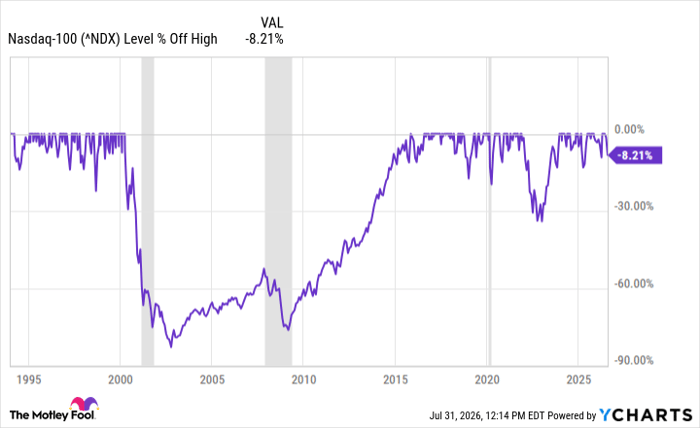
^NDX data by YCharts
Granted, some drawdowns are easier to recover from than others. It took 15 years to recover from the tech wreck that kicked off the 2000s.
But look at the bright side of these events.
If you had continued to invest throughout that bear market, you would have bought shares at some pretty low prices. That's the part of investing that requires discipline. For most people, the inclination is to sell stocks before they fall any further. In the case of the tech bubble, they may have even saved themselves some additional losses, depending on when they got out.
But most investors don't get back in until the recovery is well underway. They may or may not avoid some losses, but they usually miss out on the upside, too. By remaining invested and continuing to buy, you capture the full recovery and you buy at what's likely to be remembered as discount prices.
Historically, the market has continued to push higher. Market corrections aren't fun, but they're normal and part of the process. Handle them like a pro and you'll likely come out in better shape in the end.
Should you buy stock in Invesco QQQ Trust right now?
Before you buy stock in Invesco QQQ Trust, consider this:
The Motley Fool Stock Advisor analyst team just identified what they believe are the 10 best stocks for investors to buy now… and Invesco QQQ Trust wasn’t one of them. The 10 stocks that made the cut could produce monster returns in the coming years.
Consider when Netflix made this list on December 17, 2004... if you invested $1,000 at the time of our recommendation, you’d have $386,727!* Or when Nvidia made this list on April 15, 2005... if you invested $1,000 at the time of our recommendation, you’d have $1,232,139!*
Now, it’s worth noting Stock Advisor’s total average return is 906% — a market-crushing outperformance compared to 208% for the S&P 500. Don't miss the latest top 10 list, available with Stock Advisor, and join an investing community built by individual investors for individual investors.
See the 10 stocks »
*Stock Advisor returns as of August 3, 2026.
David Dierking has no position in any of the stocks mentioned. The Motley Fool has no position in any of the stocks mentioned. The Motley Fool has a disclosure policy.
Recommended Articles


