


Bitcoin (BTCUSD) Fluctuated Significantly on Jul 31: Key Variables Behind the Move
Bitcoin (BTCUSD) is down 1.01% at Jul 31 03:05(ET), now at $64091.83, with a 7-day down of 0.08%.
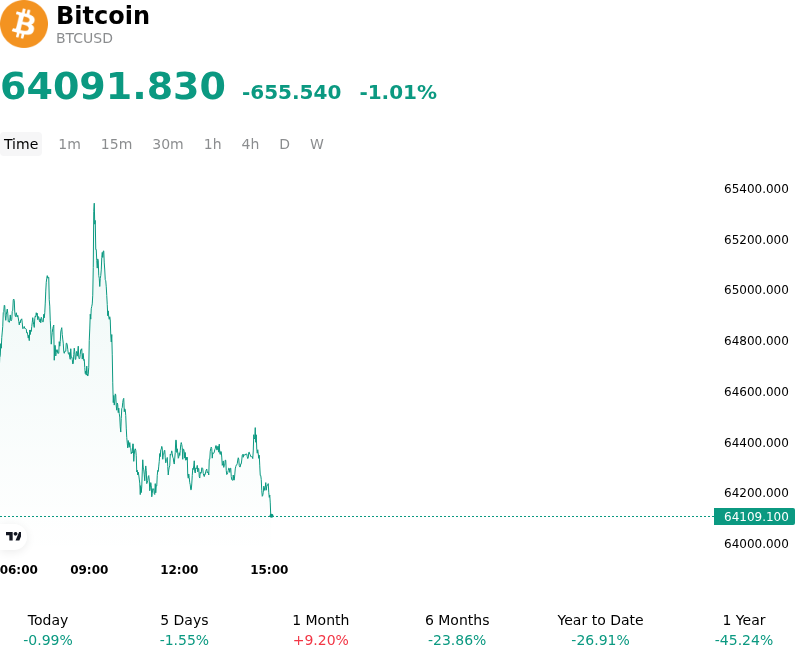
What is driving Bitcoin (BTCUSD)’s stock price down today?
The primary driver behind Bitcoin’s current price action is the convergence of the July monthly options expiry and institutional month-end rebalancing. As the largest monthly derivatives settlement of the quarter, the expiration of significant open interest in call and put options forced market makers to adjust their delta-hedging positions. This technical activity often creates localized volatility as spot prices gravitate toward max pain levels, leading to a temporary reduction in upward momentum and increased selling pressure in the spot market.
Macroeconomic liquidity conditions are providing additional headwinds following the Federal Reserve’s late-July policy meeting. The market is currently digesting a hawkish hold from the FOMC, which has supported the U.S. Dollar Index and kept 10-year Treasury yields elevated. In an environment where real yields remain restrictive, institutional appetite for risk-on assets like Bitcoin typically wanes. The strengthening dollar exerts immediate downward pressure on the BTCUSD pair, reflecting a broader deleveraging trend across global macro portfolios as investors seek the safety of cash and high-quality fixed income at the close of the month.
Spot Bitcoin ETF flow data indicates a shift toward net outflows or decelerating inflows, suggesting that the initial wave of institutional accumulation has reached a temporary plateau. Multi-asset fund managers often engage in systematic rebalancing on the final trading day of the month to maintain target weightings. Given Bitcoin’s performance earlier in the quarter, these managers are likely trimming their positions to lock in gains and realign with their risk mandates. This institutional selling, while structural in nature, lacks the aggressive conviction of a fundamental bearish shift, pointing instead to disciplined capital management.
On-chain data reveals a slight increase in exchange inflows from short-term holders, indicating a decrease in risk tolerance among retail-adjacent participants. Meanwhile, the perpetual futures market shows a cooling of funding rates, which suggests that the speculative long positions that built up earlier in the month are being flushed out. This reset in derivatives leverage is a healthy mechanism for market stability, though it results in immediate price softness as liquidations are processed.
Despite the intraday volatility, the long-term store-of-value narrative remains intact. The current decline appears to be a liquidity-driven retracement rather than a reflection of deteriorating network fundamentals or regulatory setbacks. Investors are closely monitoring upcoming labor market data and future inflation prints to determine if the Fed will pivot toward a more accommodative stance in the fourth quarter, which would be the necessary catalyst for a sustained recovery in digital asset liquidity. For now, market participants are exercising caution, prioritizing capital preservation amid shifting macro expectations.
Technical Analysis of Bitcoin (BTCUSD)
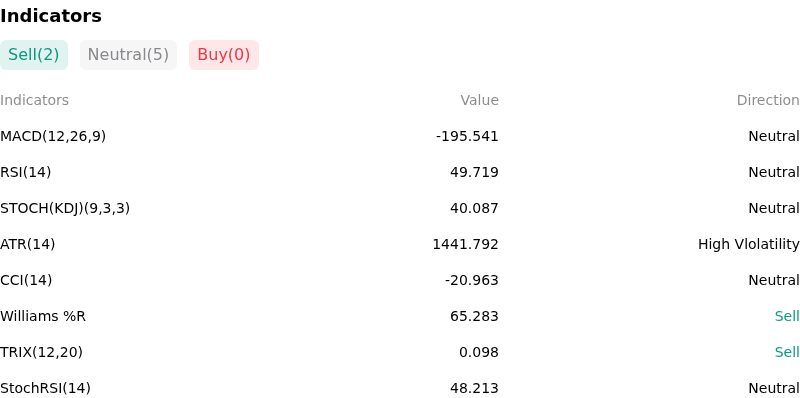
Technically, Bitcoin (BTCUSD) shows a MACD (12,26,9) value of -195.541, indicating a neutral signal. The RSI at 49.719 suggests neutral condition and the Williams %R at 65.283 suggests sell condition. Please monitor closely.
More details about Bitcoin (BTCUSD)
Recent Events and Risks:
- Spot ETF Net Outflows: After a period of sustained institutional buying, US spot Bitcoin ETFs recorded a shift to net outflows in the last 48 hours, signaling a potential exhaustion of immediate demand and removing a critical pillar of recent price support.
- Surging Treasury Yields and USD Strength: The US 10-year Treasury yield has spiked to its highest level in three months, exerting downward pressure on risk assets and tightening global liquidity conditions, which traditionally leads to intraday volatility in the BTC/USD pair.
- High Leverage and Liquidation Clusters: Derivative market data shows a significant buildup of leveraged long positions near the $66,000 level; a breach of this psychological support could trigger a cascading liquidation event, exacerbating downward price movement.
- Supply Overhang from Mt. Gox Transfers: Recent on-chain activity involving the movement of significant BTC volumes from Mt. Gox-linked wallets to exchange deposit addresses maintains a persistent threat of large-scale selling pressure as creditor distributions continue to be processed.
Recommended Articles


