


Micro Silver (XAGUSD-M) Volatility Intensified on Jul 7: What to Watch
Micro Silver (XAGUSD-M) is down 2.28% at Jul 7 01:15(ET), now at $60.581, with a 7-day up of 3.79%.
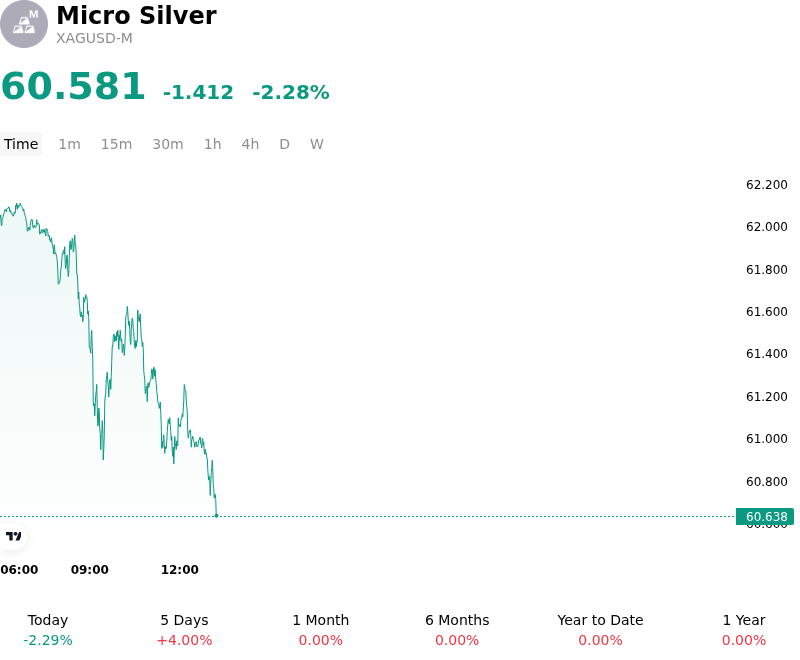
What is driving Micro Silver (XAGUSD-M)’s stock price down today?
The decline in spot silver during the trading session was primarily driven by a strengthening of the US dollar and investor positioning adjustments ahead of pivotal central bank cues. Following a sharp run-up that pushed the metal to multi-week highs, market participants engaged in a wave of tactical profit-taking as the greenback stabilized and reclaimed lost ground, dampening the appeal of dollar-denominated assets.
The near-term macroeconomic backdrop contributed heavily to the pullback. After softer-than-expected US employment data initially drove expectations of a more accommodative interest rate path and sparked a strong rally in bullion, momentum stalled. Investors adopted a highly cautious stance as they awaited the release of the Federal Reserve’s June meeting minutes. With market consensus still pricing in a significant probability of a near-term interest rate hike by the Fed, real yields remained a persistent hurdle for non-yielding assets, leading macro funds to pare back long exposure in the silver market.
In addition to shifting monetary expectations, silver experienced pressure from broader commodity and industrial sector developments. Oil prices declined as energy flows normalized through the Strait of Hormuz following a US-Iran peace agreement, and OPEC+ prepared to boost production quotas. This cooling of energy-driven inflation expectations reduced the urgent demand for precious metals as inflation hedges. Concurrently, updated investment reports signaled that industrial demand from key technology and manufacturing sectors might not expand as rapidly in the third quarter as previously forecasted, prompting a reassessment of the physical market balance.
Technically, the commodity remains sensitive to a dominant short-term bearish trend line. While silver continues to trade above its key moving averages, the failure to consolidate above psychological resistance zones prompted technical selling, which accelerated the intraday correction. Despite these headwinds, structural support remains intact, anchored by persistent deficits in global physical supply and long-term industrial demand. However, until the Federal Reserve's policy trajectory is clarified, the silver market is likely to face continued volatility driven by currency fluctuations and institutional capital adjustments.
More details about Micro Silver (XAGUSD-M)
Recent Events and Risks:
- Federal Reserve Rate and Inflation Pressure: Stubborn inflationary concerns and hawkish Federal Reserve expectations keep a potential interest rate hike on the table before the end of the year. This rate outlook maintains high real yields and a firmer U.S. dollar, driving persistent bearish pressure on non-yielding assets like silver and prompting CTAs to hold onto net-short positions.
- Strait of Hormuz Escalation and Indirect Volatility: Recent geopolitical incidents, including Iran targeting commercial vessels transiting the Strait of Hormuz, have renewed global inflation fears by pushing oil prices up. For the silver market, the resulting fear of central banks maintaining higher-for-longer interest rates to combat energy-driven inflation acts as a heavy headwind, muting silver's traditional safe-haven appeal.
- Industrial Demand Softening: Despite long-term tailwinds from green technology, near-term industrial consumption has shown distinct signs of weakening, highlighted by solar sector silver demand running approximately 19% lower year-on-year. This drop-off in industrial buying leaves silver highly vulnerable to a global manufacturing slowdown.
- Technical Vulnerability and Seller Targets: Having suffered a massive 54% decline from its January peak, XAG/USD is locked in a near-term bearish bias, remaining capped below its 20-day exponential moving average of $63.35. A failure of current support at the psychologically vital $60.00 level threatens to trigger automated stop-losses and a rapid cascade toward the seven-month low of $55.63.
Recommended Articles


