


Meme Coins Price Prediction: DOGE slips, SHIB softens, PEPE pulls back
- Dogecoin extends its correction on Tuesday after facing rejection at the weekly resistance level of $0.078.
- Shiba Inu remains under pressure after failing to break above a key descending trendline resistance.
- Pepe faces a pullback after surging over 16% in the previous week.
Dogecoin (DOGE), Shiba Inu (SHIB) and Pepe (PEPE) meme coins are trading lower on Tuesday as bullish momentum fades following last week's rally. DOGE retreats after failing to overcome a resistance level, while SHIB remains capped below a descending trendline. Meanwhile, PEPE is pulling back as traders lock in profits following its double-digit gains last week.
Dogecoin extends losses after rejecting key resistance
Dogecoin price extends its correction, trading below $0.0745 on Tuesday after facing rejection at the weekly resistance level of $0.0782 and losing 1.5% in the previous day.
If DOGE continues its correction, it could extend the losses toward the yearly low of $0.0695.
The Relative Strength Index (RSI) on the daily chart reads 35, pointing to oversold territory and indicating bearish momentum. Meanwhile, the Moving Average Convergence Divergence (MACD) showed a bullish crossover on July 3 that remains intact, supporting a positive outlook.
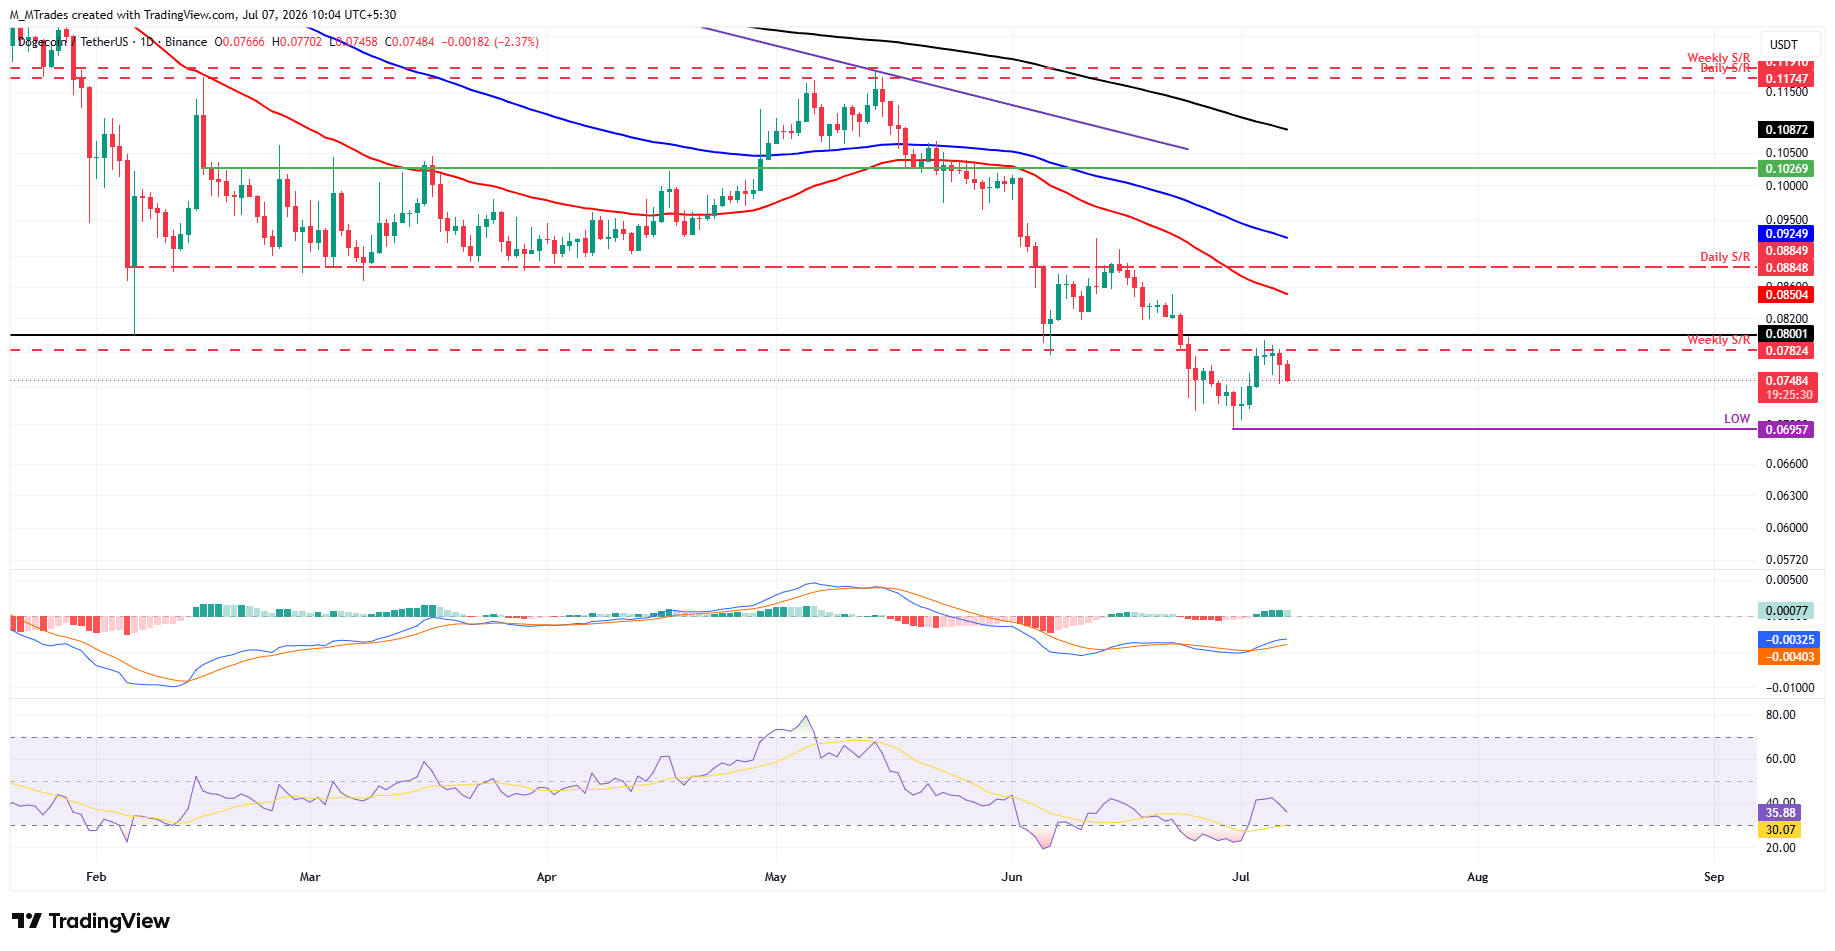
However, if DOGE recovers, it could extend the advance toward the weekly resistance at $0.0782.
Shiba Inu fails to close above the descending trendline
Shiba Inu price recovered over 6% in the previous week and retested the descending trendline near $0.0000045, which roughly coincides with the daily resistance level. On Sunday, SHIB failed to close above this resistance zone and then declined by more than 3% over the next two days, trading below $0.0000043 on Tuesday.
If SHIB continues its correction, it could extend the losses toward the yearly low of $0.0000040.
Like DOGE, SHIB's RSI and MACD indicators send mixed signals. The RSI remains below the neutral level, indicating bearish momentum; the MACD continues to flash a bullish crossover, hinting at improving underlying momentum.
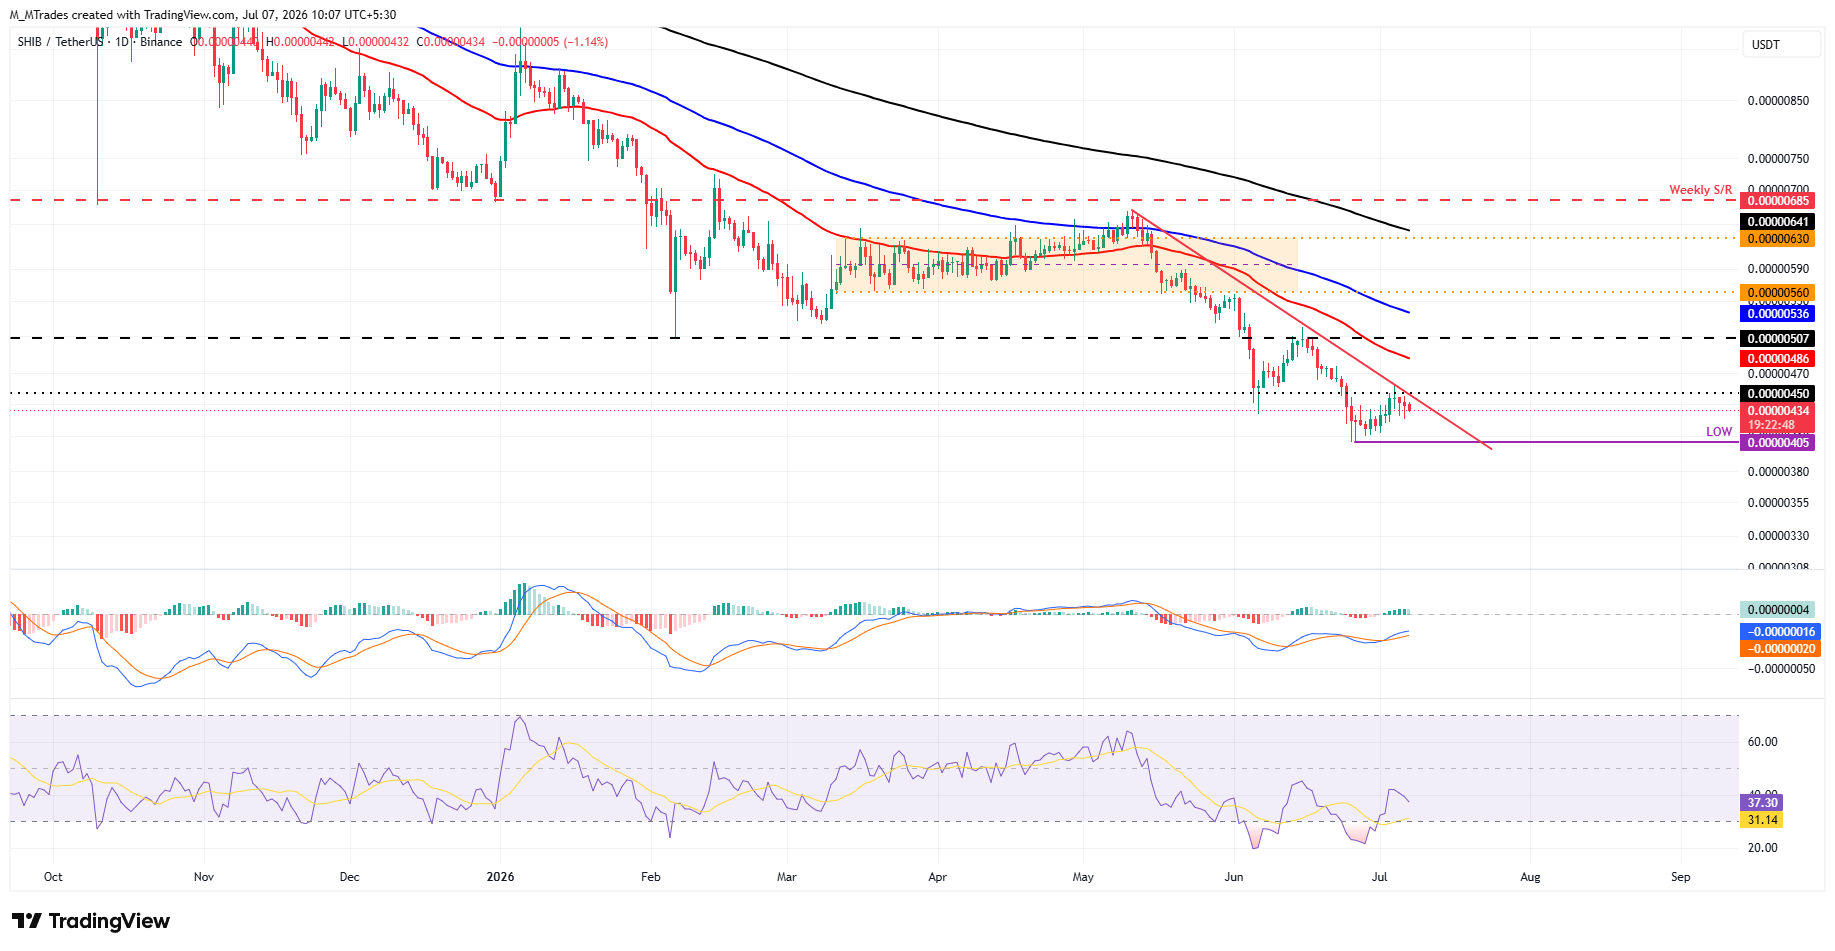
On the other hand, if SHIB recovers, it could extend the advance toward the daily resistance at $0.0000045.
Pepe takes a breather after massive gains
Pepe price rose over 16% in the previous week. Such a massive rally generally triggers profit-taking among traders, causing the meme coin to pull back. As of Monday, the start of this week, PEPE experienced a slight correction and continues its pullback on Tuesday.
If PEPE continues its pullback, it will extend the decline toward the daily support at $0.0000025, which roughly coincides with the trendline support.
The RSI reads 47, slipping below the neutral 50 level, indicating fading bullish momentum. The MACD showed a bullish crossover on July 3, which remains intact, supporting a positive outlook.
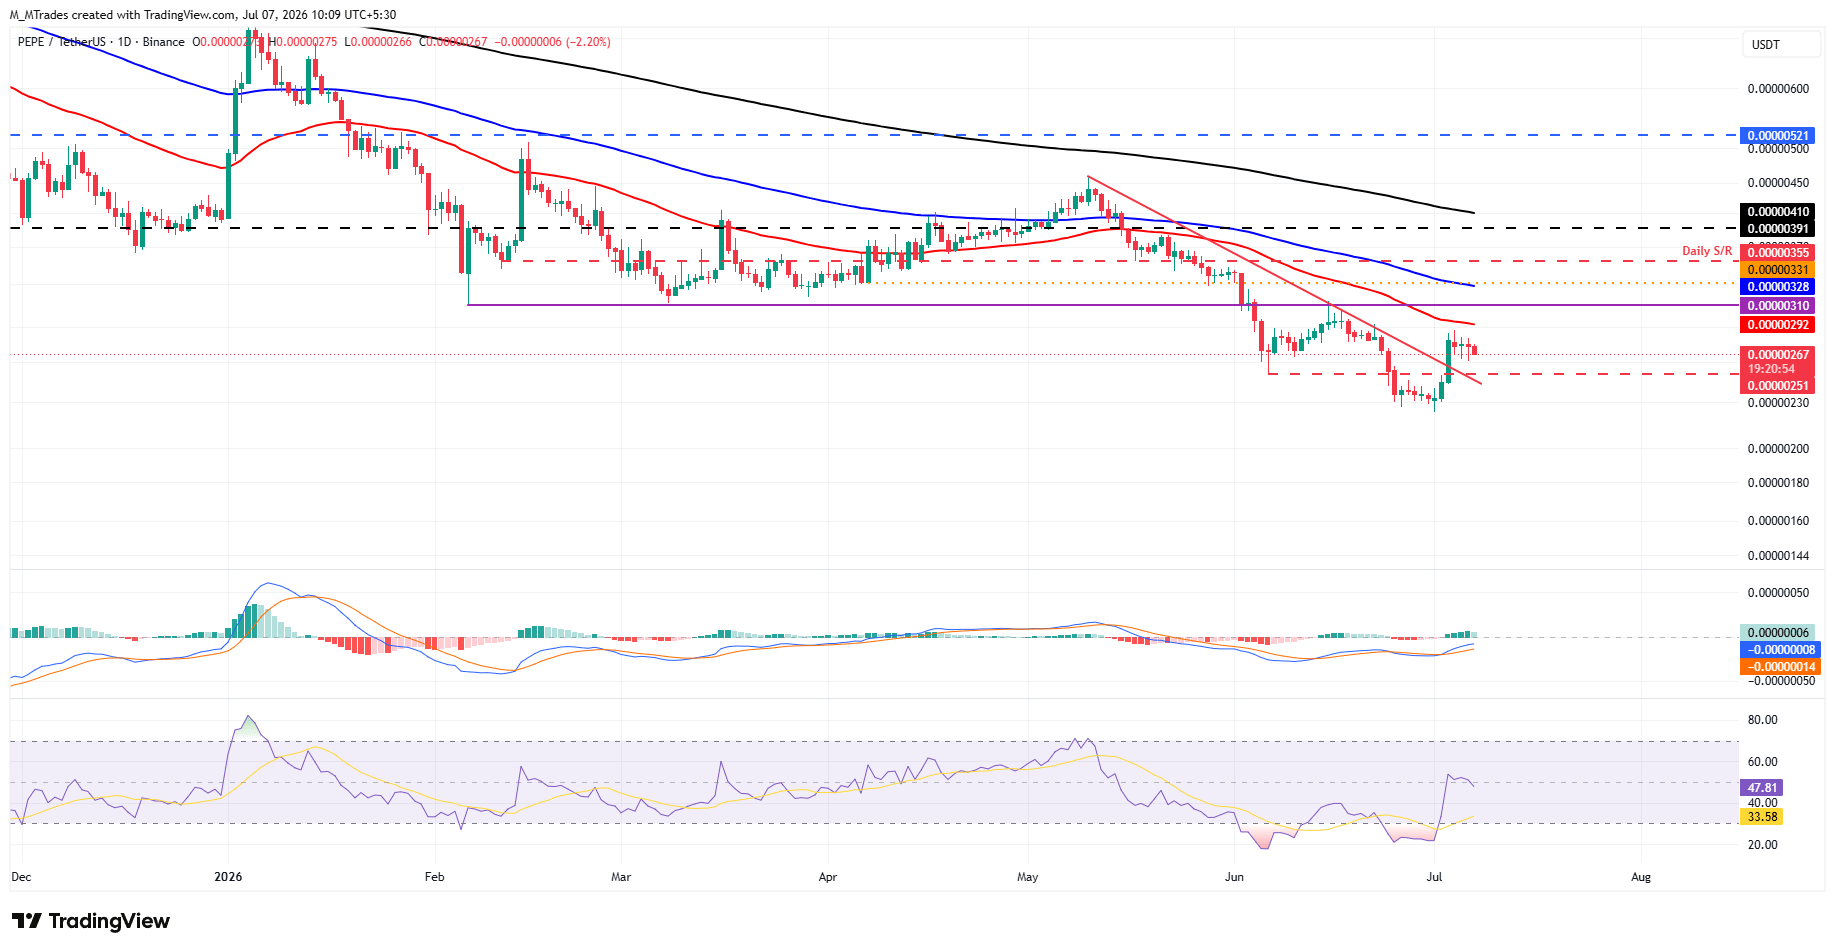
On the other hand, if PEPE recovers, it could extend the advance toward the 50-day Exponential Moving Average (EMA) at $0.0000029.
Recommended Articles


