


Indian Rupee clings to losses as oil prices rebound, FOMC Minutes eyed
- The Indian Rupee trades weakly against the US Dollar as oil prices find buying interest.
- Iran fires missiles at commercial ships transiting through the Strait of Hormuz.
- Investors keenly await the FOMC Minutes of the June policy meeting.
The Indian Rupee (INR) holds onto Monday’s losses against the US Dollar (USD) in the opening session on Tuesday. The USD/INR pair trades firmly near 95.36 as Iran’s attacks on commercial tankers transiting through the Strait of Hormuz, a vital passage for almost 20% of global energy supply, have renewed fears of energy supply disruption.
In the opening trade, the MCX Crude Oil contract expiring on July 20 trades 0.66% higher to near 6,600.
Currencies from economies, such as India, which rely heavily on oil imports to meet their energy needs, tend to underperform when oil prices rebound.
According to an Axios reporter, Iran fired at least two missiles at commercial ships transiting through the Hormuz. Two commercial ships were hit and suffered significant damage, but no casualties were reported, Bloomberg reported.
Investors keenly await FOMC Minutes
This week, the major trigger for the USD/INR pair will be the Federal Open Market Committee (FOMC) minutes of the June policy meeting, which will be released on Wednesday. Market participants will likely pay close attention to the minutes for cues on the possible reasons officials avoided delivering forward guidance on monetary policy.
In the policy meeting, the Fed decided to leave interest rates unchanged in the range of 3.50%-3.75%, and the Fed’s dot plot showed that nine of 19 policymakers were in favor of an interest rate hike by the year-end.
Currently, the CME FedWatch tool shows that the odds of the Fed delivering at least one interest rate hike by the September policy meeting are 55.2%.
FIIs turn out net buyers for second straight day
Foreign Institutional Investors (FIIs) turned out to be net buyers for the second straight trading day on Monday; however, the amount invested was significantly lower than the amount bought on Friday. On Monday, FIIs increased their stake in the Indian stock market worth Rs. 243.03 crore, lower than the Rs. 1,355.33 crore investment seen on Friday.
It appears that the return of oil prices to pre-Middle East war levels has improved the sentiment of overseas investors toward the Indian stock market.
Going forward, foreign investors will closely track India Inc.’s earnings to decide on their forward investment decisions. From the Nifty 50 basket, Tata Consultancy Services (TCS) will be the first to release its Q1FY27 earnings on Thursday.
Technical Analysis: USD/INR stays above 20-day EMA
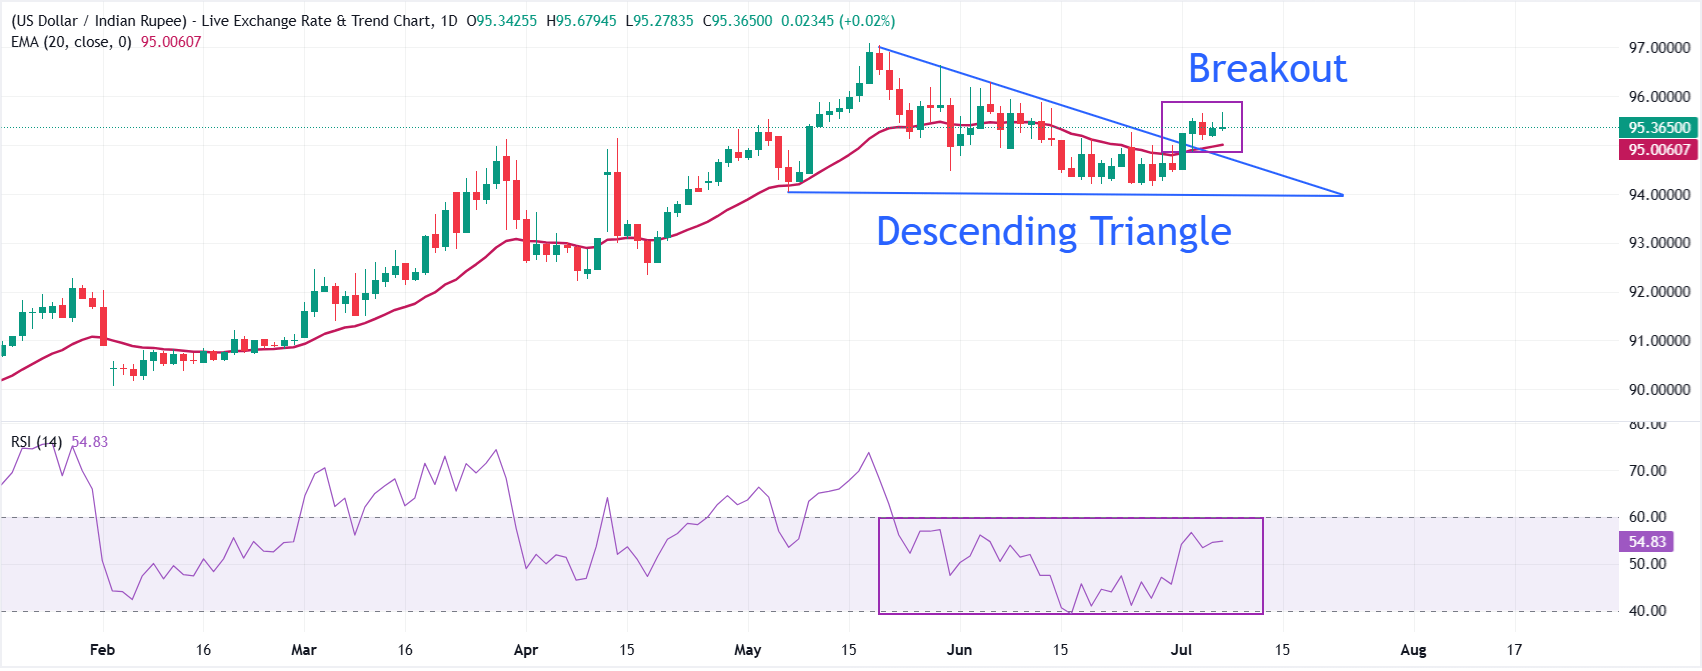
USD/INR trades flat at around 95.36, holding a mildly bullish near-term bias as spot remains above the 20-day exponential moving average (EMA) at 95.00 and holds the Descending Triangle breakout.
The Relative Strength Index (RSI) around 54.8 suggests constructive momentum rather than overbought conditions, hinting at a gradual recovery while price stays supported above the short-term EMA.
On the downside, initial support is seen at the 20-day EMA at 95.00, followed by the May 7 low at 94.03. On the topside, the pair aims to revisit the all-time high around 97.10.
(The technical analysis of this story was written with the help of an AI tool. Know more.)
Indian Rupee FAQs
The Indian Rupee (INR) is one of the most sensitive currencies to external factors. The price of Crude Oil (the country is highly dependent on imported Oil), the value of the US Dollar – most trade is conducted in USD – and the level of foreign investment, are all influential. Direct intervention by the Reserve Bank of India (RBI) in FX markets to keep the exchange rate stable, as well as the level of interest rates set by the RBI, are further major influencing factors on the Rupee.
The Reserve Bank of India (RBI) actively intervenes in forex markets to maintain a stable exchange rate, to help facilitate trade. In addition, the RBI tries to maintain the inflation rate at its 4% target by adjusting interest rates. Higher interest rates usually strengthen the Rupee. This is due to the role of the ‘carry trade’ in which investors borrow in countries with lower interest rates so as to place their money in countries’ offering relatively higher interest rates and profit from the difference.
Macroeconomic factors that influence the value of the Rupee include inflation, interest rates, the economic growth rate (GDP), the balance of trade, and inflows from foreign investment. A higher growth rate can lead to more overseas investment, pushing up demand for the Rupee. A less negative balance of trade will eventually lead to a stronger Rupee. Higher interest rates, especially real rates (interest rates less inflation) are also positive for the Rupee. A risk-on environment can lead to greater inflows of Foreign Direct and Indirect Investment (FDI and FII), which also benefit the Rupee.
Higher inflation, particularly, if it is comparatively higher than India’s peers, is generally negative for the currency as it reflects devaluation through oversupply. Inflation also increases the cost of exports, leading to more Rupees being sold to purchase foreign imports, which is Rupee-negative. At the same time, higher inflation usually leads to the Reserve Bank of India (RBI) raising interest rates and this can be positive for the Rupee, due to increased demand from international investors. The opposite effect is true of lower inflation.
Recommended Articles


