


Silver (XAGUSD) Is down by 2.05% on Jul 7: Is the Demand Outlook Changing?
Silver (XAGUSD) is down 2.05% at Jul 7 01:10(ET), now at $60.737, with a 7-day up of 4.07%.
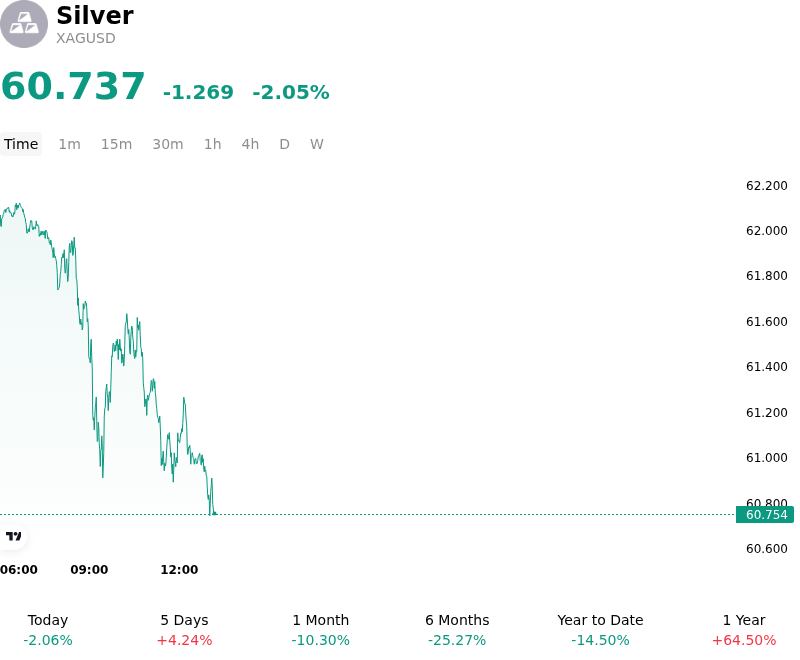
What is driving Silver (XAGUSD)’s stock price down today?
Spot silver prices experienced downward pressure as a combination of macroeconomic positioning and technical factors prompted a correction. The metal pulled back from recent multi-week highs as a firmer US dollar and a stabilization in Treasury yields dampened the momentum of non-yielding precious metals.
Market participants are primarily focused on the macroeconomic outlook, with capital flows showing a high degree of caution ahead of the release of the Federal Reserve’s June monetary policy meeting minutes. While recent soft US employment data had previously fueled optimism for a more accommodative central bank stance, the broader landscape remains characterized by concerns that interest rates will stay higher for longer. This expectation continues to elevate real yields, increasing the opportunity cost of holding non-interest-bearing bullion and motivating institutional investors to adjust their portfolios.
Geopolitical factors also played a dual role in shaping commodity market dynamics. News of rising tensions in the Middle East, particularly reports of attacks on commercial shipping in the Strait of Hormuz, diverted immediate investor focus and capital toward the energy sector, helping crude oil attract bids while taking some of the safe-haven shine off silver.
From a technical perspective, the price action reflects a deeper corrective sequence. Despite experiencing a strong short-covering bounce in preceding sessions, silver remains capped below major moving averages, including its short-term exponential moving averages and its 200-day simple moving average. The inability to sustain a breakout above key technical resistance has re-engaged sellers, keeping the near-term bias tilted to the downside.
Structurally, silver continues to be supported over a longer horizon by a persistent annual physical deficit and robust industrial consumption, particularly from the photovoltaic and electronics sectors. However, short-term price movements remain heavily dictated by US dollar fluctuations, shifts in Federal Reserve policy expectations, and capital rebalancing within the derivatives market.
Technical Analysis of Silver (XAGUSD)
Technically, Silver (XAGUSD) shows a MACD (12,26,9) value of 0.883, indicating a neutral signal. The RSI at 40.053 suggests neutral condition and the Williams %R at 62.486 suggests sell condition. Please monitor closely.
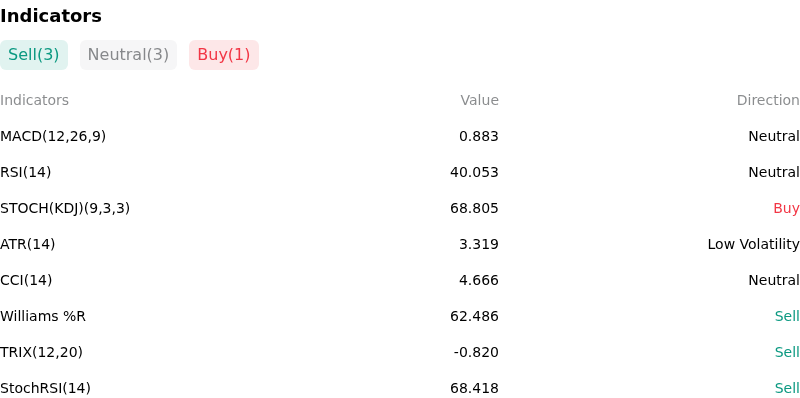
More details about Silver (XAGUSD)
Recent Events and Risks:
- Unwinding of Safe-Haven Premium: Intraday and near-term selling pressure on XAGUSD has accelerated as regional geopolitical risks subside, particularly with the normalization of shipping flows and the unwinding of the safe-haven premium linked to the Strait of Hormuz crisis.
- Macro-Driven Fed Policy Drag: Despite minor labor market cooling, sticky wage inflation and hawkish Federal Reserve messaging continue to fuel concerns of "higher-for-longer" interest rates. This macro outlook bolsters the U.S. dollar and real yields, increasing the opportunity cost of holding non-yielding precious metals.
- ETF Disinterest and Investment Outflows: Physical and paper silver instruments continue to face liquidation, while silver-backed exchange-traded funds (ETFs) remain "friendless" and devoid of inflows, leaving the current minor technical rebounds highly vulnerable to sudden sell-offs.
- Technical Breakdown and Downside Momentum: XAGUSD recently experienced a significant structural breakdown by closing below its multi-month floor of $64.50. Trading below both its 21-day and 200-day Simple Moving Averages (SMAs) has established a firm bearish bias, leaving the metal exposed to a drop toward key support at $55.00 and long-term targets near $42.00.
Recommended Articles


