Solana Price Forecast: SOL breakout fuels optimism amid ETF buzz

แหล่งที่มา Fxstreet
  • Solana price breaks above its descending trendline, indicating a potential shift to an upward trend.
  • REX Shares files for a Solana staking ETF with the SEC, signaling that a launch could be on the horizon.
  • Technical outlook turns bullish, with SOL eyeing a rally toward the $184 resistance level and beyond.

Solana (SOL) price trades around $151 at the time of writing on Monday, after breaking above its descending trendline last week, suggesting an upward trend ahead. REX Shares files for a Solana staking ETF with the US Securities and Exchange Commission (SEC), signaling that a launch could happen soon. The technical outlook suggests a rally, targeting levels above $180.

Is Solana ETF coming soon?

REX Shares posted on its X account on Saturday that its REX-Osprey SOL and staking ETF is designed to track the performance of Solana while generating yield through onchain staking and will be launched soon.
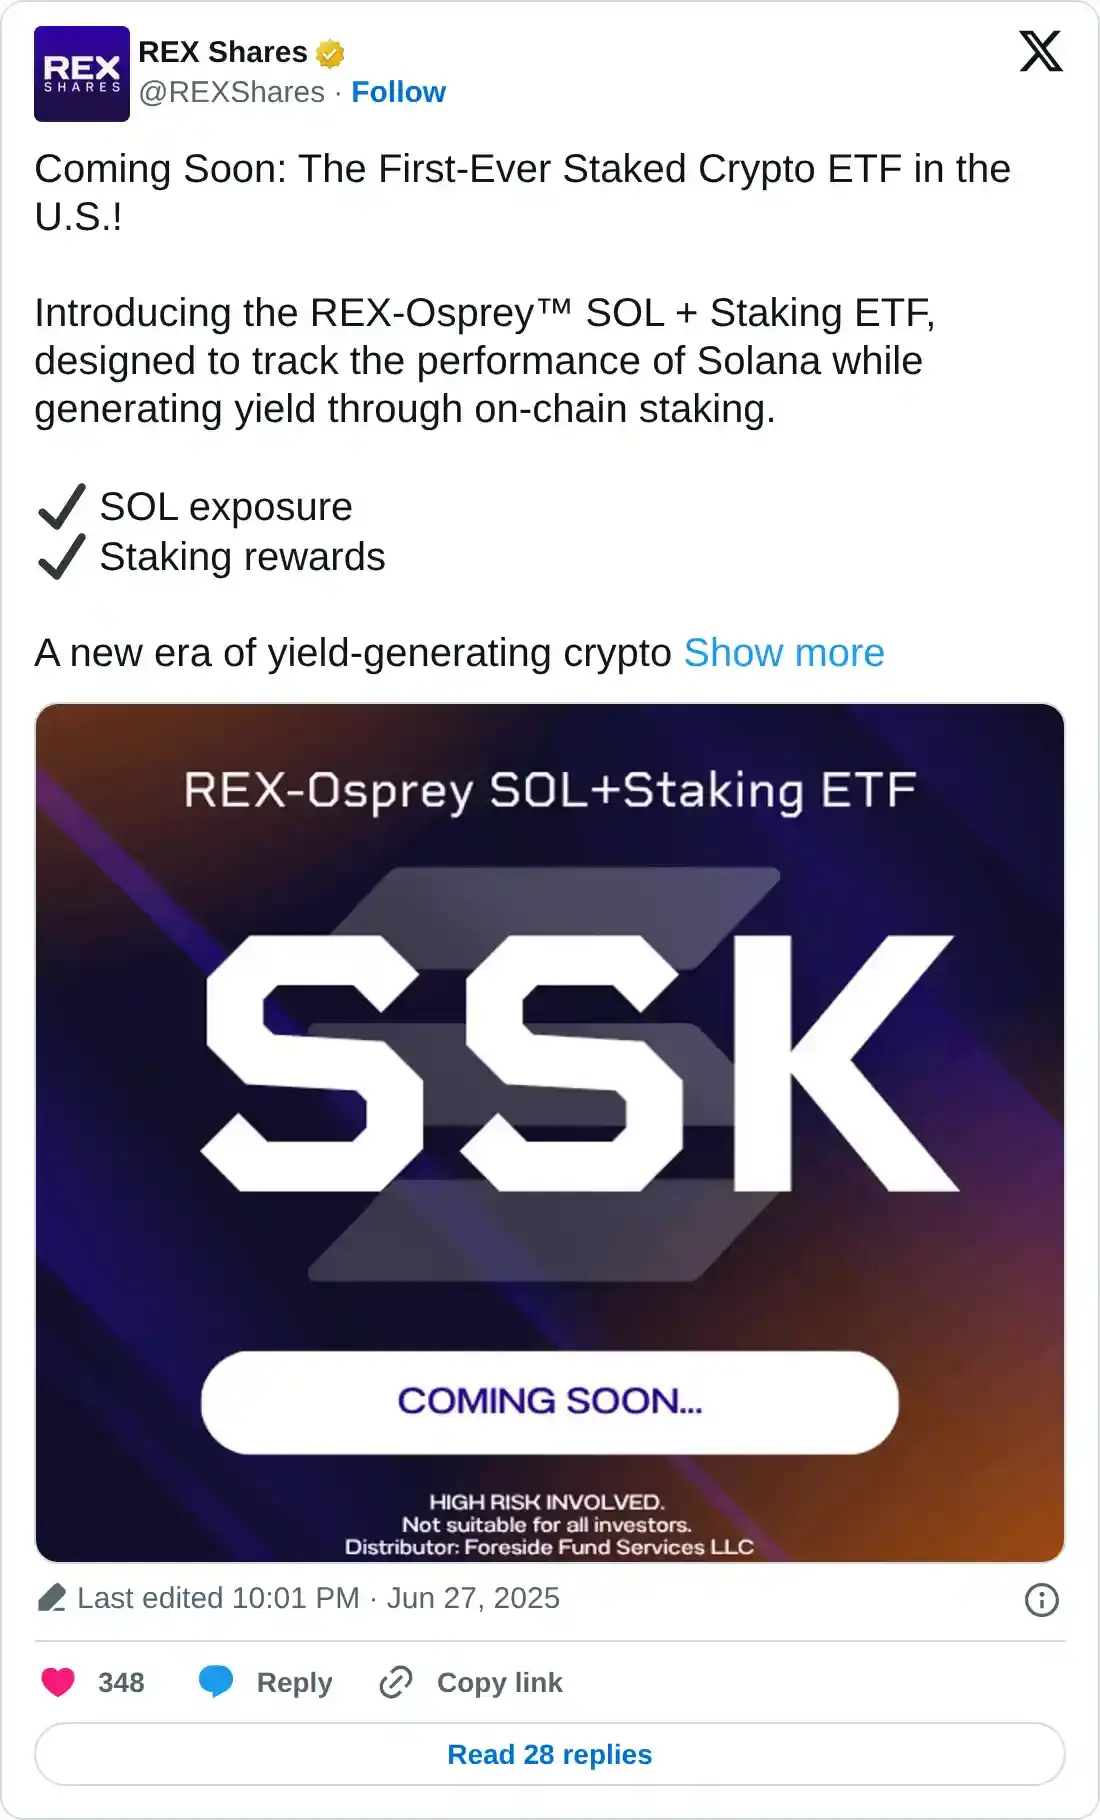
https://twitter.com/REXShares/status/1938719417258647982

Eric Balchunas, Senior ETF Analyst for Bloomberg, also posted on X on the same day that the 

Rex has just filed a letter with the US SEC, asking if comments have been resolved for their ‘40 Act Solana Staking ETF. 

Balchunas posted: “They’re no doubt trying to get it to mkt ahead of the spot ones.”

He also cited an email screenshot to confirm that REX Shares has addressed the SEC’s comments.

“So they are good to launch, it looks like. Wow,” Balchunas added.
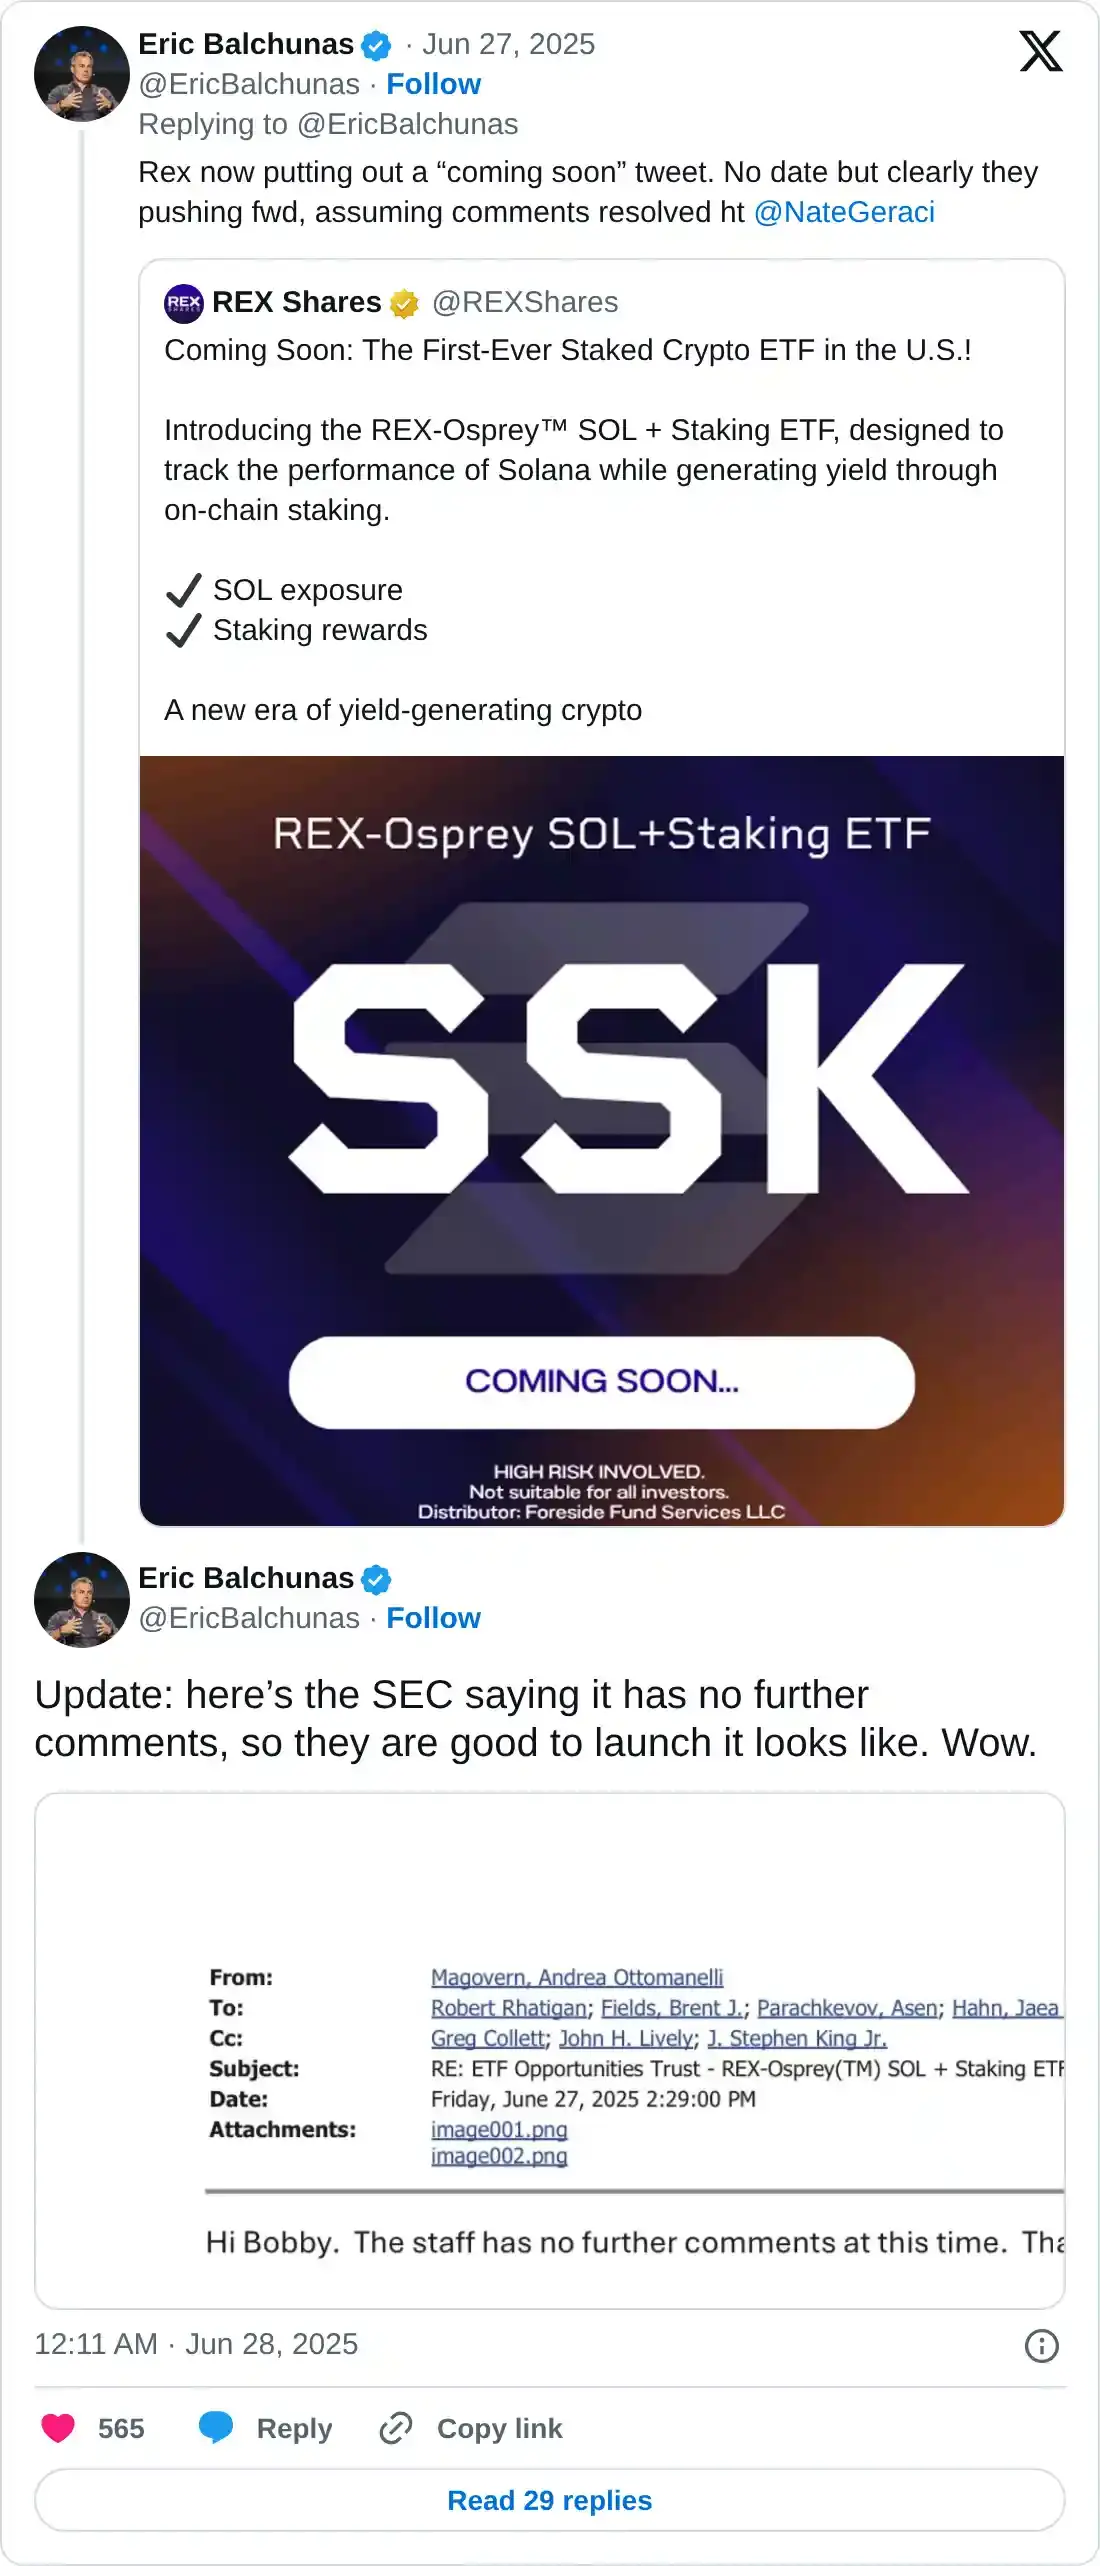
https://twitter.com/EricBalchunas/status/1938752099564560864

Solana Price Forecast: SOL breakout of the descending trendline

Solana price broke out and closed above the descending trendline (drawn by connecting multiple highs since May 24) on Saturday and rallied to close above its 50-day Exponential Moving Average (EMA) at $151.48 the next day. At the time of writing on Monday, it hovers around the 50-day EMA level at $151.48.

If SOL continues its upward trend, it could extend the rally toward its daily resistance level at $160. A successful close above this level could extend additional gains to retest its next daily resistance at $184.13.

The Relative Strength Index (RSI) on the daily chart reads 52, above its neutral level of 50, indicating that bullish momentum is gaining traction. The Moving Average Convergence Divergence (MACD) on the daily chart also displayed a bullish crossover on Saturday, providing a buy signal and indicating an upward trend.
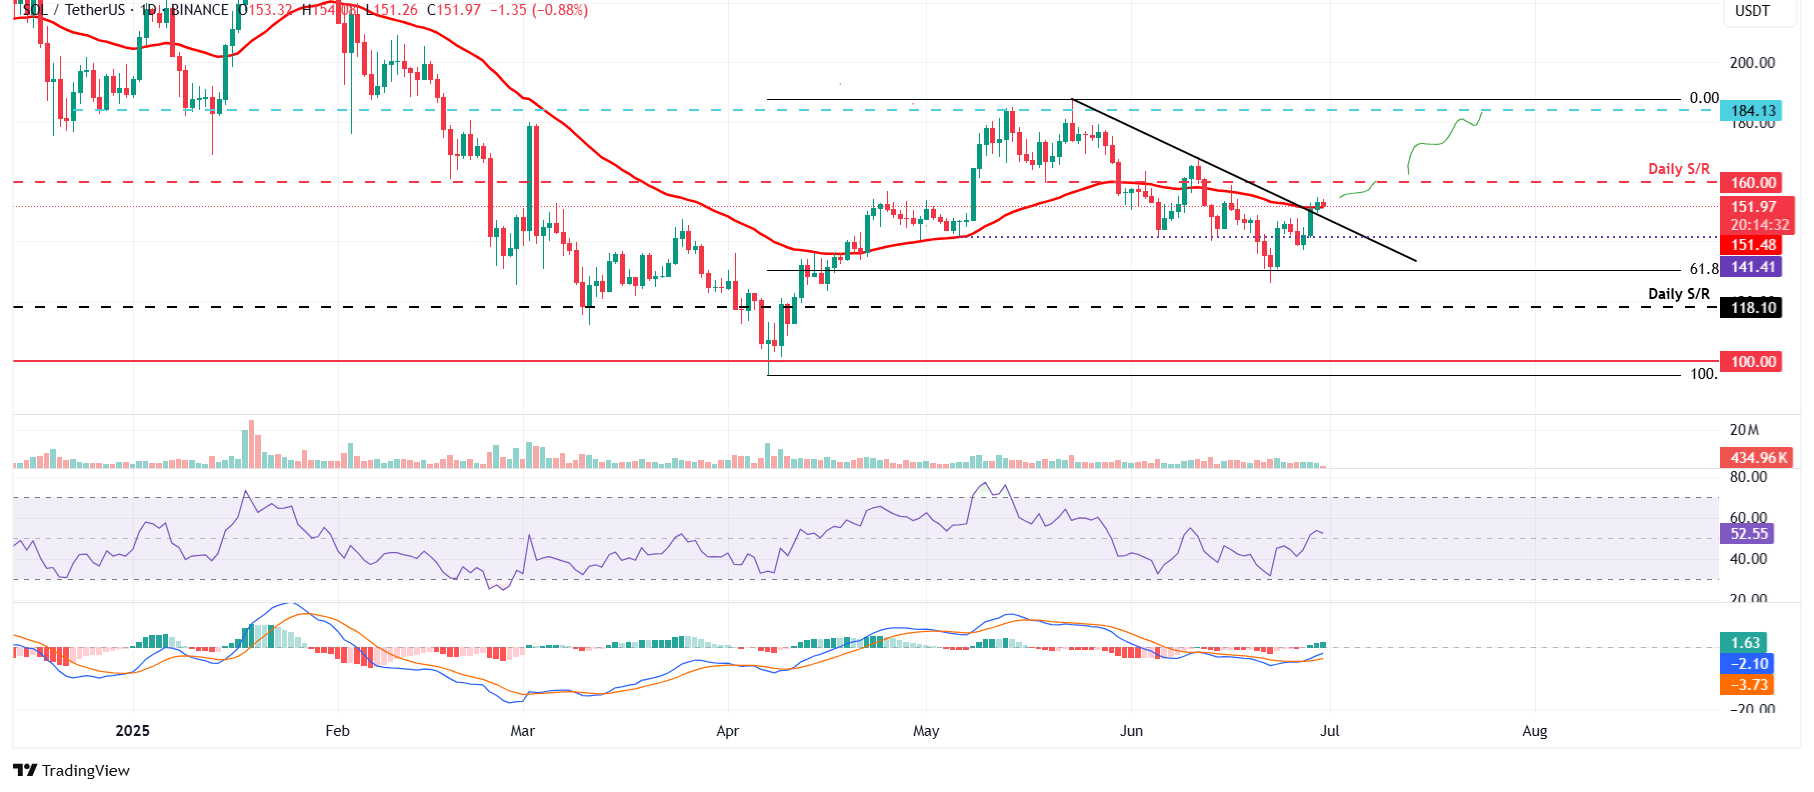
SOL/USDT daily chart 

SOL/USDT daily chart 

However, if SOL faces a correction, it could extend the decline toward its next support level at $141.41.


ข้อจำกัดความรับผิดชอบ: เพื่อการอ้างอิงเท่านั้น ผลการดำเนินงานในอดีตไม่ได้บ่งบอกถึงผลลัพธ์ในอนาคต
placeholder
Top 3 Price Prediction Bitcoin, Ethereum, Ripple: BTC, ETH and XRP show strength ahead of Trump’s inaugurationBitcoin’s (BTC) price continues to trade green, trading above $100,900 on Friday after rallying almost 7% so far this week.
ผู้เขียน  FXStreet
1 เดือน 17 วัน ศุกร์
Bitcoin’s (BTC) price continues to trade green, trading above $100,900 on Friday after rallying almost 7% so far this week.
placeholder
ราคาทองคำพุ่งขึ้นสู่ระดับใกล้เคียง $3,500; แนวโน้มขาขึ้นที่แข็งแกร่งยังคงไม่หยุดยั้งราคาทองคํา (XAU/USD) สร้างแรงผลักดันจากการทะลุระดับในวันก่อนหน้าที่เหนือระดับ $3,400 และยังคงปรับตัวขึ้นสู่ระดับสูงสุดใหม่ในช่วงเช้าของตลาดลงทุนเอเชียวันอังคาร
ผู้เขียน  FXStreet
4 เดือน 22 วัน อังคาร
ราคาทองคํา (XAU/USD) สร้างแรงผลักดันจากการทะลุระดับในวันก่อนหน้าที่เหนือระดับ $3,400 และยังคงปรับตัวขึ้นสู่ระดับสูงสุดใหม่ในช่วงเช้าของตลาดลงทุนเอเชียวันอังคาร
placeholder
คาดการณ์ราคาทองคำ: XAU/USD ขยายการปรับตัวลงใกล้ $3,250 จากความต้องการความเสี่ยงที่ดีขึ้นราคาทองคํา (XAU/USD) ปรับตัวลดลงต่อเนื่องมาอยู่ที่ประมาณ $3,265 ในช่วงเช้าของตลาดลงทุนเอเชียวันจันทร์ โลหะมีค่าร่วงลงใกล้ระดับต่ำสุดในรอบหนึ่งเดือนหลังจากข้อตกลงการค้าระหว่างสหรัฐฯ และจีนช่วยเพิ่มความต้องการเสี่ยง นักลงทุนรอการแสดงความคิดเห็นจากเฟดในวันจันทร์เพื่อเป็นแรงกระตุ้นใหม่
ผู้เขียน  FXStreet
6 เดือน 30 วัน จันทร์
ราคาทองคํา (XAU/USD) ปรับตัวลดลงต่อเนื่องมาอยู่ที่ประมาณ $3,265 ในช่วงเช้าของตลาดลงทุนเอเชียวันจันทร์ โลหะมีค่าร่วงลงใกล้ระดับต่ำสุดในรอบหนึ่งเดือนหลังจากข้อตกลงการค้าระหว่างสหรัฐฯ และจีนช่วยเพิ่มความต้องการเสี่ยง นักลงทุนรอการแสดงความคิดเห็นจากเฟดในวันจันทร์เพื่อเป็นแรงกระตุ้นใหม่
placeholder
GBP/USD ยังคงรักษาตำแหน่งเหนือ 1.3700 ก่อนข้อมูล GDP ไตรมาสที่ 1 ของสหราชอาณาจักรGBP/USD ขยับสูงขึ้นเล็กน้อยก่อนการประกาศข้อมูลผลิตภัณฑ์มวลรวมภายในประเทศ (GDP) ของสหราชอาณาจักรในไตรมาสแรก โดยซื้อขายอยู่ที่ประมาณ 1.3720 ในช่วงชั่วโมงการลงทุนเอเชียวันจันทร์
ผู้เขียน  FXStreet
23 ชั่วโมงที่แล้ว
GBP/USD ขยับสูงขึ้นเล็กน้อยก่อนการประกาศข้อมูลผลิตภัณฑ์มวลรวมภายในประเทศ (GDP) ของสหราชอาณาจักรในไตรมาสแรก โดยซื้อขายอยู่ที่ประมาณ 1.3720 ในช่วงชั่วโมงการลงทุนเอเชียวันจันทร์
placeholder
AUD/JPY ดึงดูดผู้ขายบางรายใกล้ 94.50 เนื่องจากบรรยากาศทางธุรกิจของญี่ปุ่นดีขึ้นคู่ AUD/JPY ดึงดูดผู้ขายบางส่วนมาที่ประมาณ 94.50 ในช่วงเช้าของตลาดลงทุนเอเชียวันอังคาร เงินเยนญี่ปุ่น (JPY) ปรับตัวสูงขึ้นเมื่อเทียบกับออสซี่หลังจากผลสำรวจ Tankan ของญี่ปุ่นที่ออกมาดี เทรดเดอร์เตรียมพร้อมสำหรับข้อมูลยอดค้าปลีกของออสเตรเลียในเดือนพฤษภาคมที่จะประกาศในวันพุธนี้
ผู้เขียน  FXStreet
4 ชั่วโมงที่แล้ว
คู่ AUD/JPY ดึงดูดผู้ขายบางส่วนมาที่ประมาณ 94.50 ในช่วงเช้าของตลาดลงทุนเอเชียวันอังคาร เงินเยนญี่ปุ่น (JPY) ปรับตัวสูงขึ้นเมื่อเทียบกับออสซี่หลังจากผลสำรวจ Tankan ของญี่ปุ่นที่ออกมาดี เทรดเดอร์เตรียมพร้อมสำหรับข้อมูลยอดค้าปลีกของออสเตรเลียในเดือนพฤษภาคมที่จะประกาศในวันพุธนี้
ตราสารที่เกี่ยวข้อง
goTop
quote