

Dogecoin Price Forecast: Bullish divergence, whale accumulation support recovery hopes

แหล่งที่มา Fxstreet
  • Dogecoin trades at $0.070 on Tuesday with bullish momentum divergence, suggesting bearish momentum may be losing strength.
  • Santiment data shows signs of accumulation among certain whale wallets, suggesting a bullish outlook.
  • Derivatives metrics support a bullish bias with rising long bets and positive funding rates.

Dogecoin (DOGE) shows early signs of a potential recovery, trading near $0.070 at the time of writing on Tuesday as bullish momentum divergence suggests selling pressure may be fading. In addition, whale accumulation and improving derivatives metrics suggest a bullish outlook, hinting at a potential recovery ahead.

Whale wallets buy DOGE dips

Santiment’s Supply Distribution data shows that large-wallet holders (whales) are steadily buying DOGE, a move that supports the positive outlook for the token.

The metric indicates that 10 million and 100 million DOGE tokens (blue line) have accumulated a total of 180 million DOGE tokens, while 100,000 and 1 million (red line) have sold 10 million tokens since Saturday. This buy-the-dip scenario signals continued long-term interest among large-wallet holders and supports a potential recovery ahead.

DOGE supply distribution chart. Source: Santiment

Derivatives metrics show a bullish outlook

Derivatives data also shows bullish sentiment among Dogecoin traders. CoinGlass’ long-to-short ratio for memecoin reads 1.27 on Tuesday, the highest level over a month. A ratio above one indicates bullish sentiment, as traders are betting the asset price will rise.
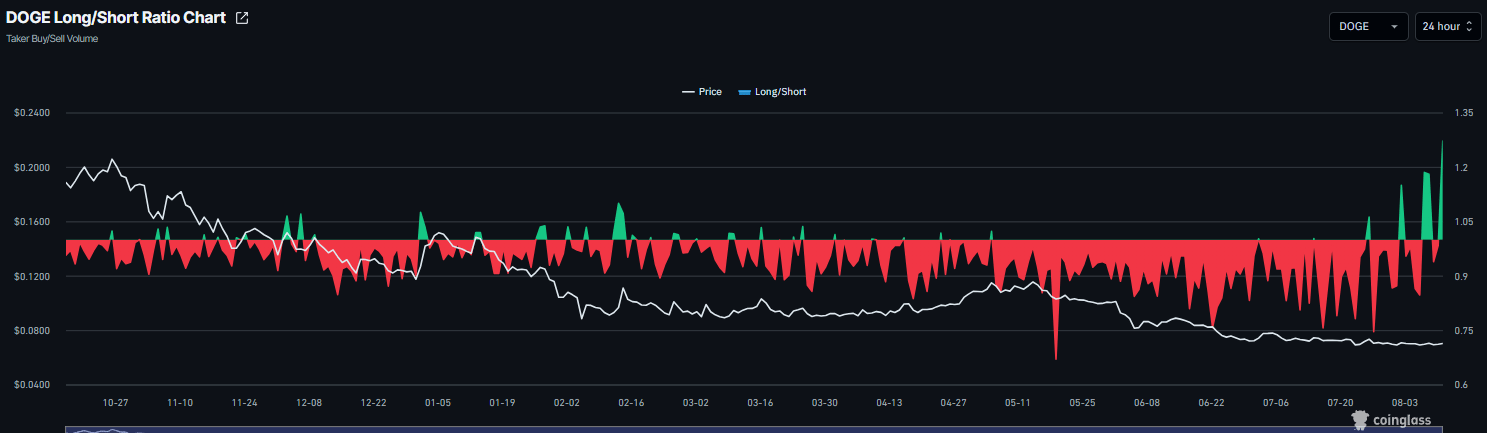
Dogecoin long-to-short ratio chart. Source: Coinglass

In addition, CoinGlass’ funding rates metric for Dogecoin flipped positive on July 24, steadily rising to 0.0096% on Tuesday. These positive rates indicate that long traders are paying shorts and reflect a bullish bias for the dog-themed meme coin.
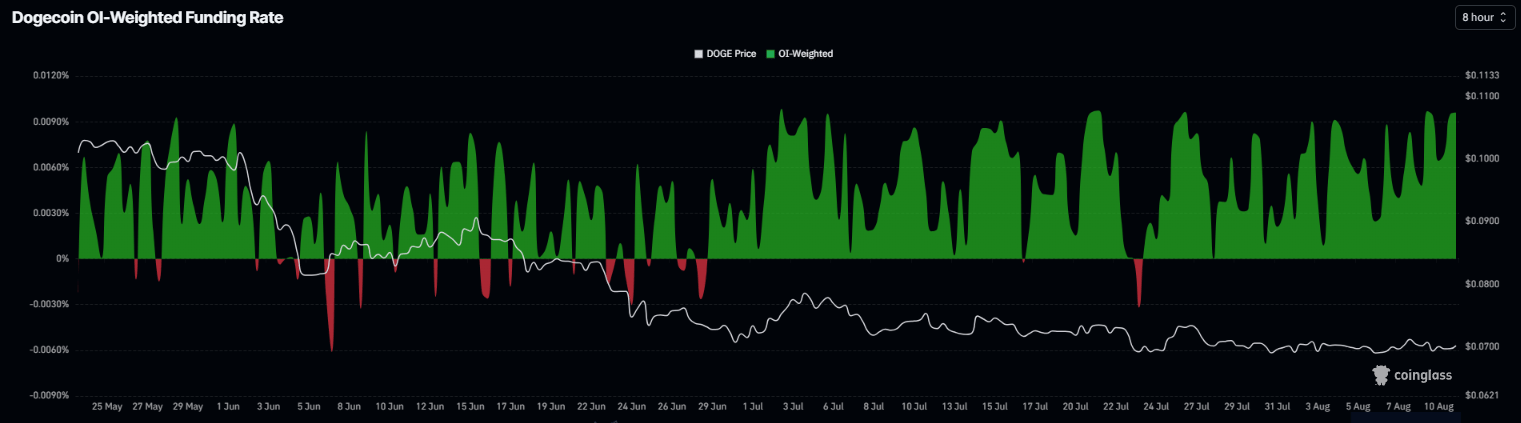
Dogecoin funding rates chart. Source: Coinglass

Dogecoin technical outlook: Bullish divergence in play

Dogecoin trades at $0.070 on Tuesday, extending its consolidation just above the psychological $0.0700 floor but well beneath all key Exponential Moving Averages (EMAs), keeping the near-term tone bearish. DOGE remains capped by the 50-day EMA at $0.074 and the 100-day EMA at $0.081, reinforcing a broader downside bias. 

Momentum indicators show a bullish divergence in the Relative Strength Index (RSI) on the daily chart, as DOGE price formed a lower low on August 1 while the RSI registered a higher low, suggesting that bearish momentum is weakening. The Awesome Oscillator (AO) supports this divergence as its recent lows are rising while price remains near its lows, indicating that downside momentum is fading.

On the topside, initial resistance emerges at the 50-day EMA around $0.074, followed by the downward trendline break level near $0.076, where any recovery would likely face renewed supply. Above that, the 100-day EMA at $0.081 and horizontal barrier at $0.088 form a wider cap that DOGE must clear to signal a more durable bullish reversal. 

On the downside, immediate support is seen at the horizontal line around $0.070, with next support at the yearly low at $0.067; a close below it suggests deeper losses toward the key psychological level of $0.065. 
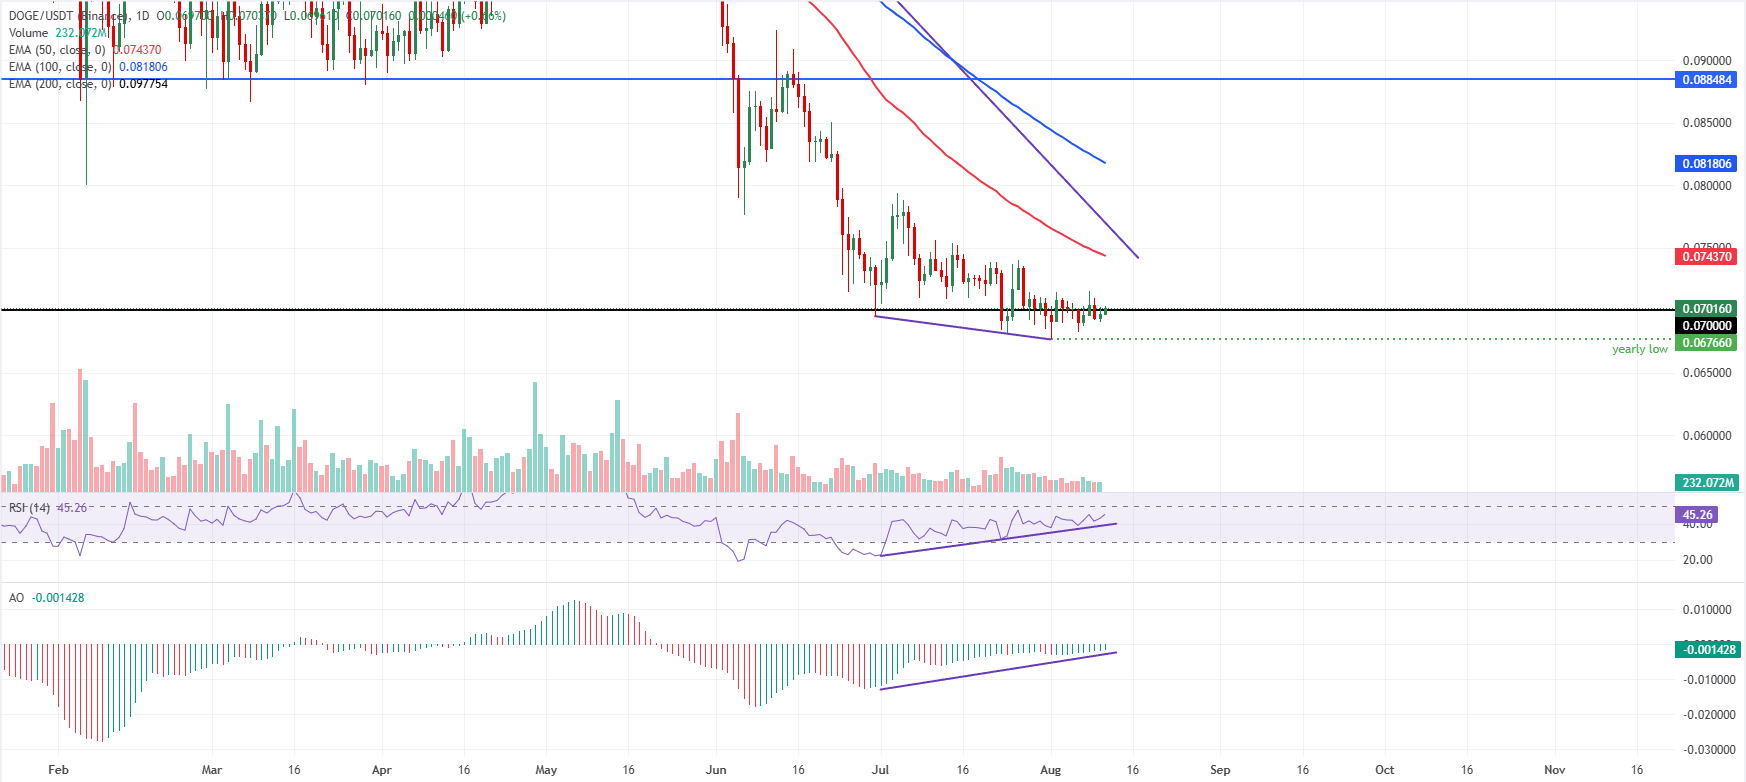
DOGE/USDT daily chart

(The technical analysis of this story was written with the help of an AI tool. Know more.)

ข้อจำกัดความรับผิดชอบ: เพื่อการอ้างอิงเท่านั้น ผลการดำเนินงานในอดีตไม่ได้บ่งบอกถึงผลลัพธ์ในอนาคต
placeholder
ข่าวหุ้นวันนี้ งานสหรัฐอ่อนดันหุ้น–ทองฟื้น แต่น้ำมันยังขวาง Fed ขณะ SET บวกแรงแบบไม่ทั่วตลาดทันทุกกระแสการเงิน สรุปข่าวเด่น Forex หุ้น ทองคำ คริปโตฯ และเศรษฐกิจรอบวัน วิเคราะห์แนวโน้มตลาดด้วยข้อมูลเชิงลึก อ่านง่าย เข้าใจไว อัปเดตล่าสุดที่นี่
ผู้เขียน  Mitrade
เมื่อวาน 06: 17
ทันทุกกระแสการเงิน สรุปข่าวเด่น Forex หุ้น ทองคำ คริปโตฯ และเศรษฐกิจรอบวัน วิเคราะห์แนวโน้มตลาดด้วยข้อมูลเชิงลึก อ่านง่าย เข้าใจไว อัปเดตล่าสุดที่นี่
placeholder
คาดการณ์ราคาโลหะเงิน: XAG/USD เริ่มต้นสัปดาห์การรายงาน CPI ของสหรัฐฯ แบบทรงตัวที่บริเวณ 63.50 ดอลลาร์ราคาโลหะเงิน (XAGUSD) เคลื่อนไหวอยู่ในกรอบแคบๆ ที่ประมาณ $63.50 ในช่วงตลาดเอเชียเปิดทำการต้นสัปดาห์ โลหะเงินยังพยายามหาทิศทาง แต่ยังอยู่ใกล้ระดับสูงสุดในรอบเกือบเจ็ดสัปดาห์ที่ $65.16 ซึ่งทำไว้เมื่อวันศุกร์
ผู้เขียน  FXStreet
22 ชั่วโมงที่แล้ว
ราคาโลหะเงิน (XAGUSD) เคลื่อนไหวอยู่ในกรอบแคบๆ ที่ประมาณ $63.50 ในช่วงตลาดเอเชียเปิดทำการต้นสัปดาห์ โลหะเงินยังพยายามหาทิศทาง แต่ยังอยู่ใกล้ระดับสูงสุดในรอบเกือบเจ็ดสัปดาห์ที่ $65.16 ซึ่งทำไว้เมื่อวันศุกร์
placeholder
ทองคำถอยลงจากระดับสูงสุดนับตั้งแต่วันที่ 17 มิถุนายน ท่ามกลางการแข็งค่าขึ้นของ USD ยืนเหนือแนวรับสำคัญที่ $4,300ทองคำ (XAUUSD) ปรับตัวลดลงในช่วงเริ่มต้นสัปดาห์ใหม่ และเคลื่อนตัวออกจากระดับสูงสุดนับตั้งแต่วันที่ 17 มิถุนายน ซึ่งแตะไว้เมื่อวันศุกร์หลังการเปิดเผยรายงานการจ้างงานนอกภาคเกษตร (NFP) ของสหรัฐฯ ที่น่าผิดหวัง
ผู้เขียน  FXStreet
21 ชั่วโมงที่แล้ว
ทองคำ (XAUUSD) ปรับตัวลดลงในช่วงเริ่มต้นสัปดาห์ใหม่ และเคลื่อนตัวออกจากระดับสูงสุดนับตั้งแต่วันที่ 17 มิถุนายน ซึ่งแตะไว้เมื่อวันศุกร์หลังการเปิดเผยรายงานการจ้างงานนอกภาคเกษตร (NFP) ของสหรัฐฯ ที่น่าผิดหวัง
placeholder
คาดการณ์ราคา EURUSD: เส้น SMA 100 วันจำกัดการฟื้นตัวของยูโรยูโรมีแนวโน้มปิดเซสชั่นวันจันทร์ด้วยการปรับตัวลดลงประมาณ 0.13% เมื่อเทียบกับเงินดอลลาร์ เนื่องจากข่าวล่าสุดชี้ให้เห็นว่าการเจรจาระหว่างสหรัฐฯ และอิหร่านอาจล่าช้าออกไป ขณะที่ในมุมมองทางเทคนิค EUR/USD ชะลอตัวลงที่เส้นค่าเฉลี่ยเคลื่อนที่อย่างง่าย (SMA) 100 วันใกล้กับระดับ 1.1568.
ผู้เขียน  FXStreet
3 ชั่วโมงที่แล้ว
ยูโรมีแนวโน้มปิดเซสชั่นวันจันทร์ด้วยการปรับตัวลดลงประมาณ 0.13% เมื่อเทียบกับเงินดอลลาร์ เนื่องจากข่าวล่าสุดชี้ให้เห็นว่าการเจรจาระหว่างสหรัฐฯ และอิหร่านอาจล่าช้าออกไป ขณะที่ในมุมมองทางเทคนิค EUR/USD ชะลอตัวลงที่เส้นค่าเฉลี่ยเคลื่อนที่อย่างง่าย (SMA) 100 วันใกล้กับระดับ 1.1568.
placeholder
WTI พุ่งขึ้นกว่า 6% ขณะที่ยังไม่มีความแน่นอนเกี่ยวกับการเปิดช่องแคบฮอร์มุซอีกครั้งน้ำมันดิบเวสต์เท็กซัส (WTI) พุ่งขึ้นมากกว่า 6% ในวันจันทร์ ลบล้างการขาดทุนเมื่อสัปดาห์ที่แล้ว ขณะที่ความไม่แน่นอนเกี่ยวกับการเปิดช่องแคบฮอร์มุซอีกครั้งเมื่อใด ยังคงทำให้ความกังวลด้านอุปทานและค่าพรีเมียมความเสี่ยงทางภูมิรัฐศาสตร์อยู่ในระดับสูง ในขณะที่เขียนข่าวนี้ ราคา WTI ซื้อขายอยู่ที่ประมาณ 81.15 ดอลลาร์ต่อบาร์เรล ใกล้ระดับสูงสุดในรอบหนึ่งสัปดาห์
ผู้เขียน  FXStreet
2 ชั่วโมงที่แล้ว
น้ำมันดิบเวสต์เท็กซัส (WTI) พุ่งขึ้นมากกว่า 6% ในวันจันทร์ ลบล้างการขาดทุนเมื่อสัปดาห์ที่แล้ว ขณะที่ความไม่แน่นอนเกี่ยวกับการเปิดช่องแคบฮอร์มุซอีกครั้งเมื่อใด ยังคงทำให้ความกังวลด้านอุปทานและค่าพรีเมียมความเสี่ยงทางภูมิรัฐศาสตร์อยู่ในระดับสูง ในขณะที่เขียนข่าวนี้ ราคา WTI ซื้อขายอยู่ที่ประมาณ 81.15 ดอลลาร์ต่อบาร์เรล ใกล้ระดับสูงสุดในรอบหนึ่งสัปดาห์
ตราสารที่เกี่ยวข้อง
goTop
quote