

Crypto Today: Bitcoin, Ethereum, XRP slide further as risk-off sentiment deepens
- Bitcoin faces extended pressure as institutional investors reduce their risk exposure.
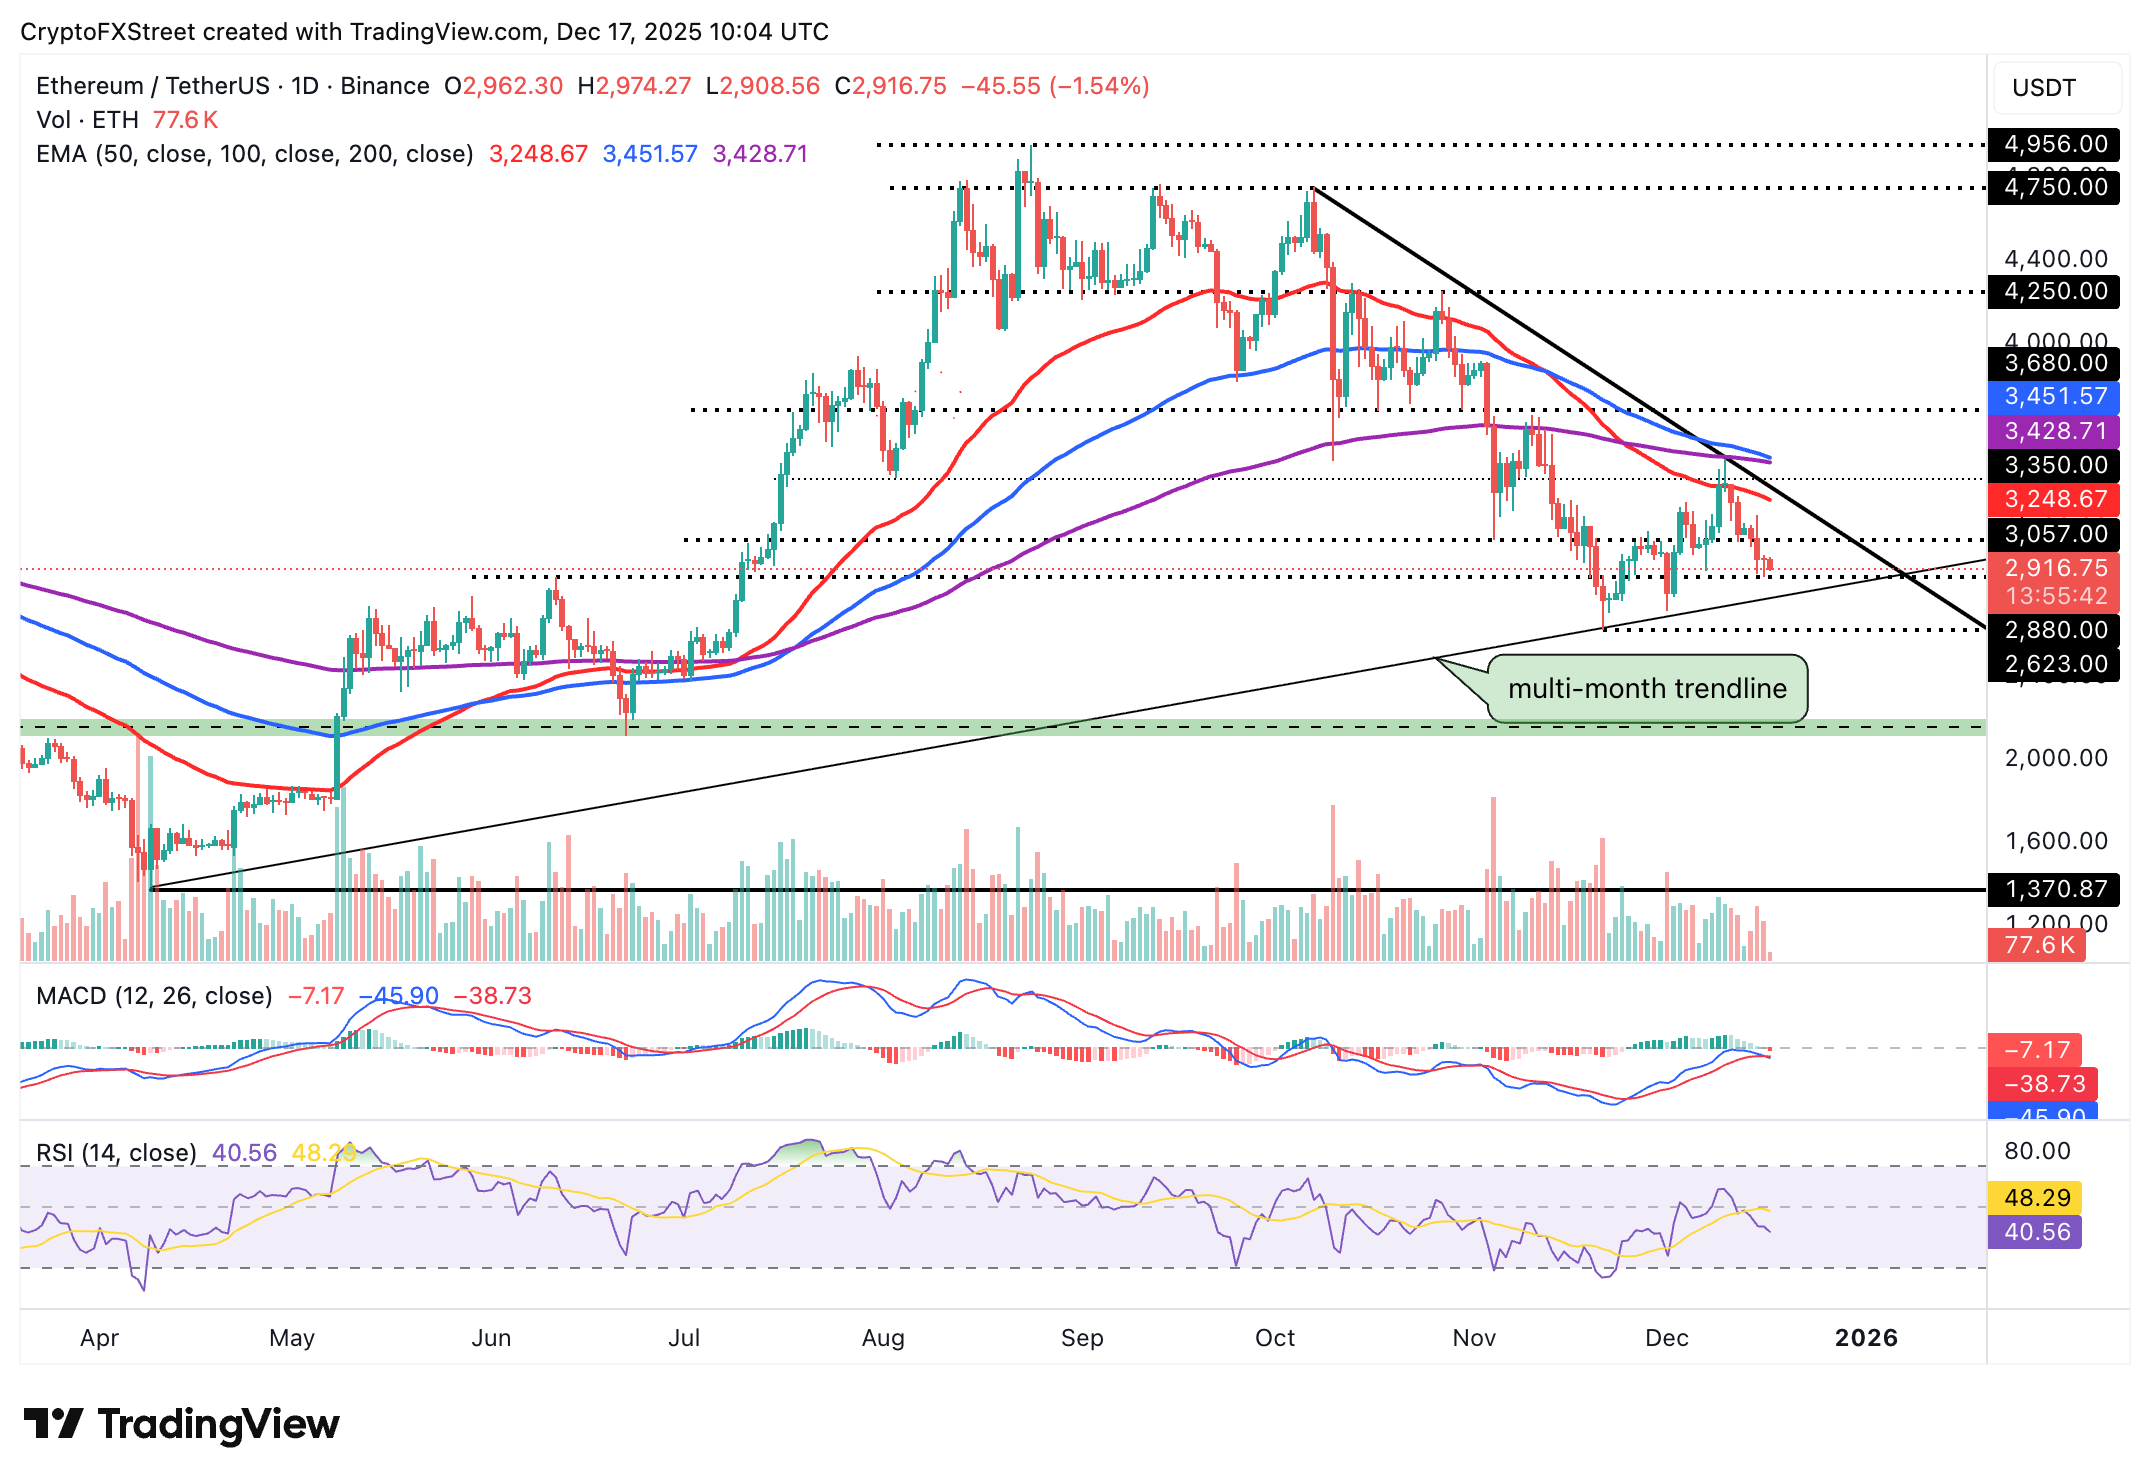
- Ethereum’s upside capped at $3,000, weighed down by ETF outflows and bearish signals.
- XRP slides toward November’s support at $1.82 despite mild ETF inflows.
Bitcoin (BTC) is edging lower toward $86,000 at the time of writing on Wednesday amid broad risk aversion sentiment in the cryptocurrency market. Ethereum (ETH) holds above $2,900, but its upside has been capped at $3,000 amid diminishing institutional interest. Ripple (XRP) trades marginally below $1.90 despite mild but steady Exchange Traded Funds (ETF) inflows.
Data spotlight: XRP extends ETF inflows while BTC, ETH see outflows
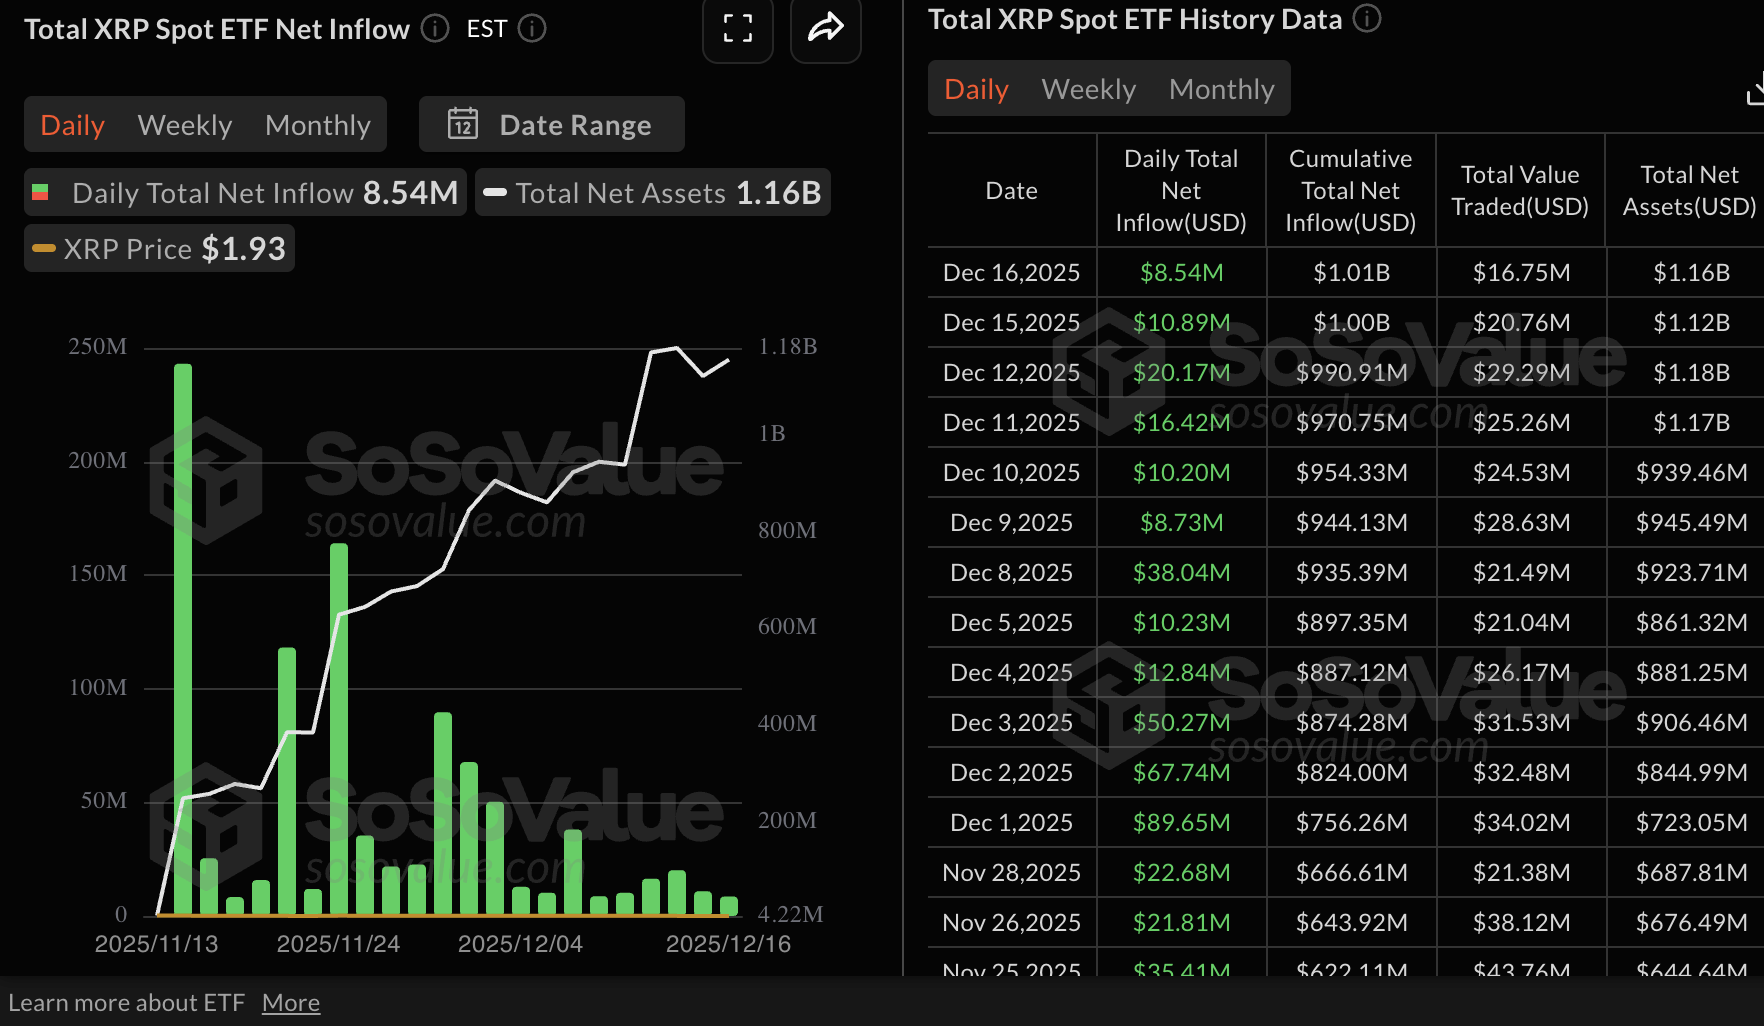
XRP spot ETFs extended their inflow streak, with approximately $8.5 million deposited on Tuesday.
Bitwise’s XRP ETF led with approximately $6.2 million in inflows, followed by Franklin Templeton’s XRPZ with nearly $2.1 million. The cumulative inflow stands at $1.01 billion and net assets at $1.16 billion, according to SoSoValue data.
Since their debut on November 13, XRP ETFs have not experienced outflows, underscoring the growing institutional interest in altcoin-based crypto investment products.
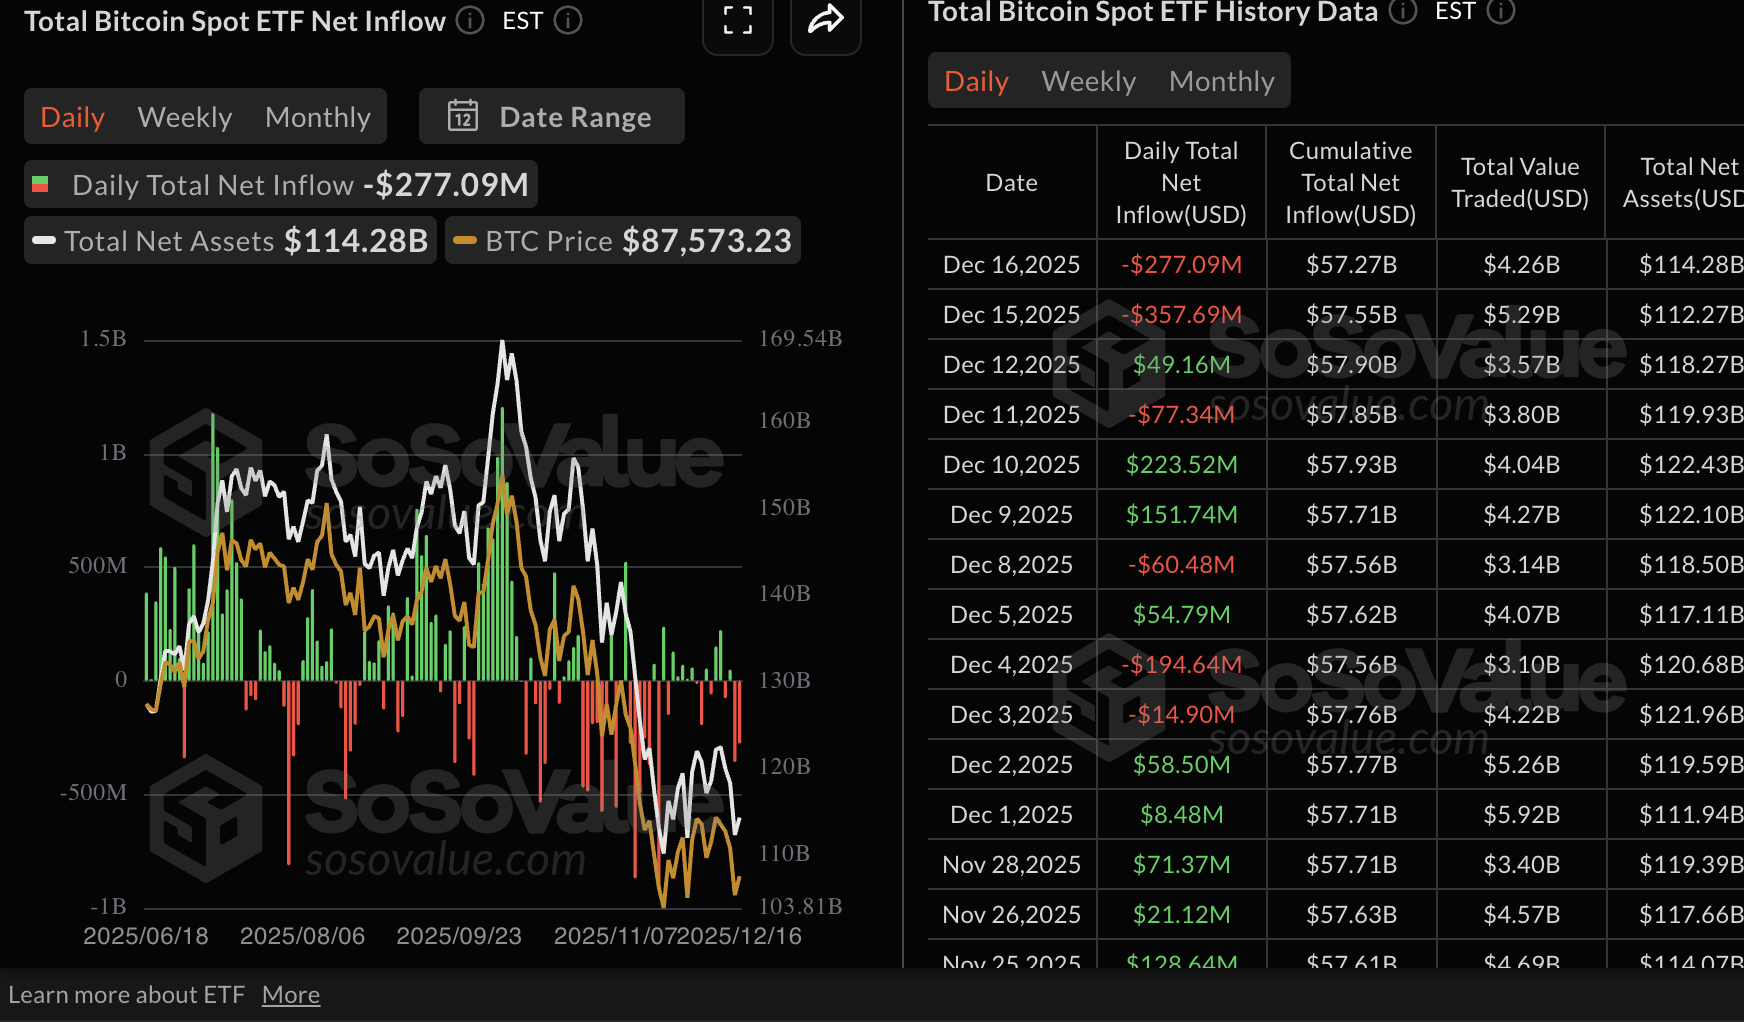
On the contrary, Bitcoin spot ETFs recorded approximately $277 million in outflows on Tuesday amid persistent risk-off sentiment among institutional investors. This marks the second consecutive day of outflows, following investors' withdrawal of nearly $358 million on Monday.
The cumulative net inflow volume currently stands at $57.27 billion, while net assets average $114.28 billion.
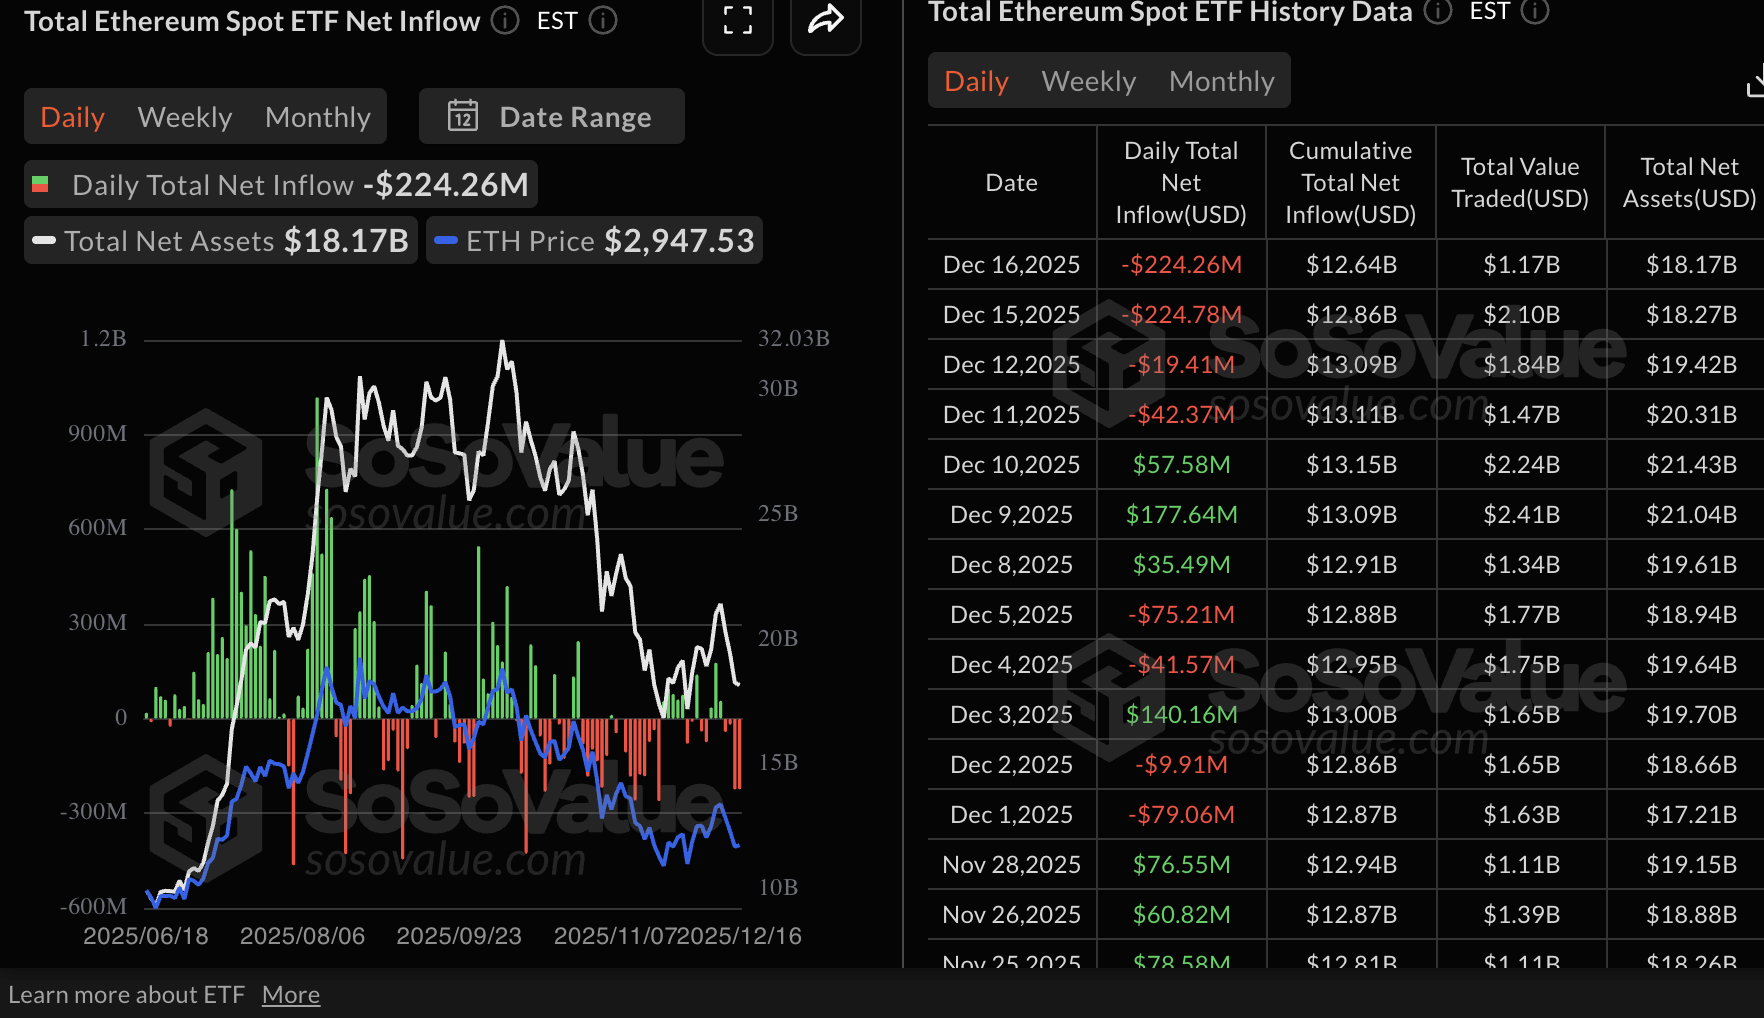
Meanwhile, Ethereum ETFs extended their outflow streak for the fourth consecutive day, with roughly $224 million withdrawn on Tuesday. BlackRock’s ETHA ETF posted the largest outflows of $221 million, followed by Fidelity’s FETH with nearly $3 million. SoSoValue data shows cumulative inflow volume at $12.64 billion and net assets of $18.17 billion.
According to a K33 Research report, risk-off sentiment will likely continue to engulf the crypto market, especially after the Federal Reserve’s (Fed) rate cut decision in December, which was accompanied by a hawkish commentary, and renewed macroeconomic uncertainty heading into the New Year.
“While the rate cut provided some short-term relief, accompanying commentary signaling a renewed 'wait-and-see' stance from the Fed dampened broader market sentiment. Futures markets are currently pricing a 73% probability of unchanged rates at the January 28 FOMC meeting, alongside a 47.6% probability of no change at the March 18 meeting,” K33 Research stated.
Chart of the day: Bitcoin trades under pressure as losses extend
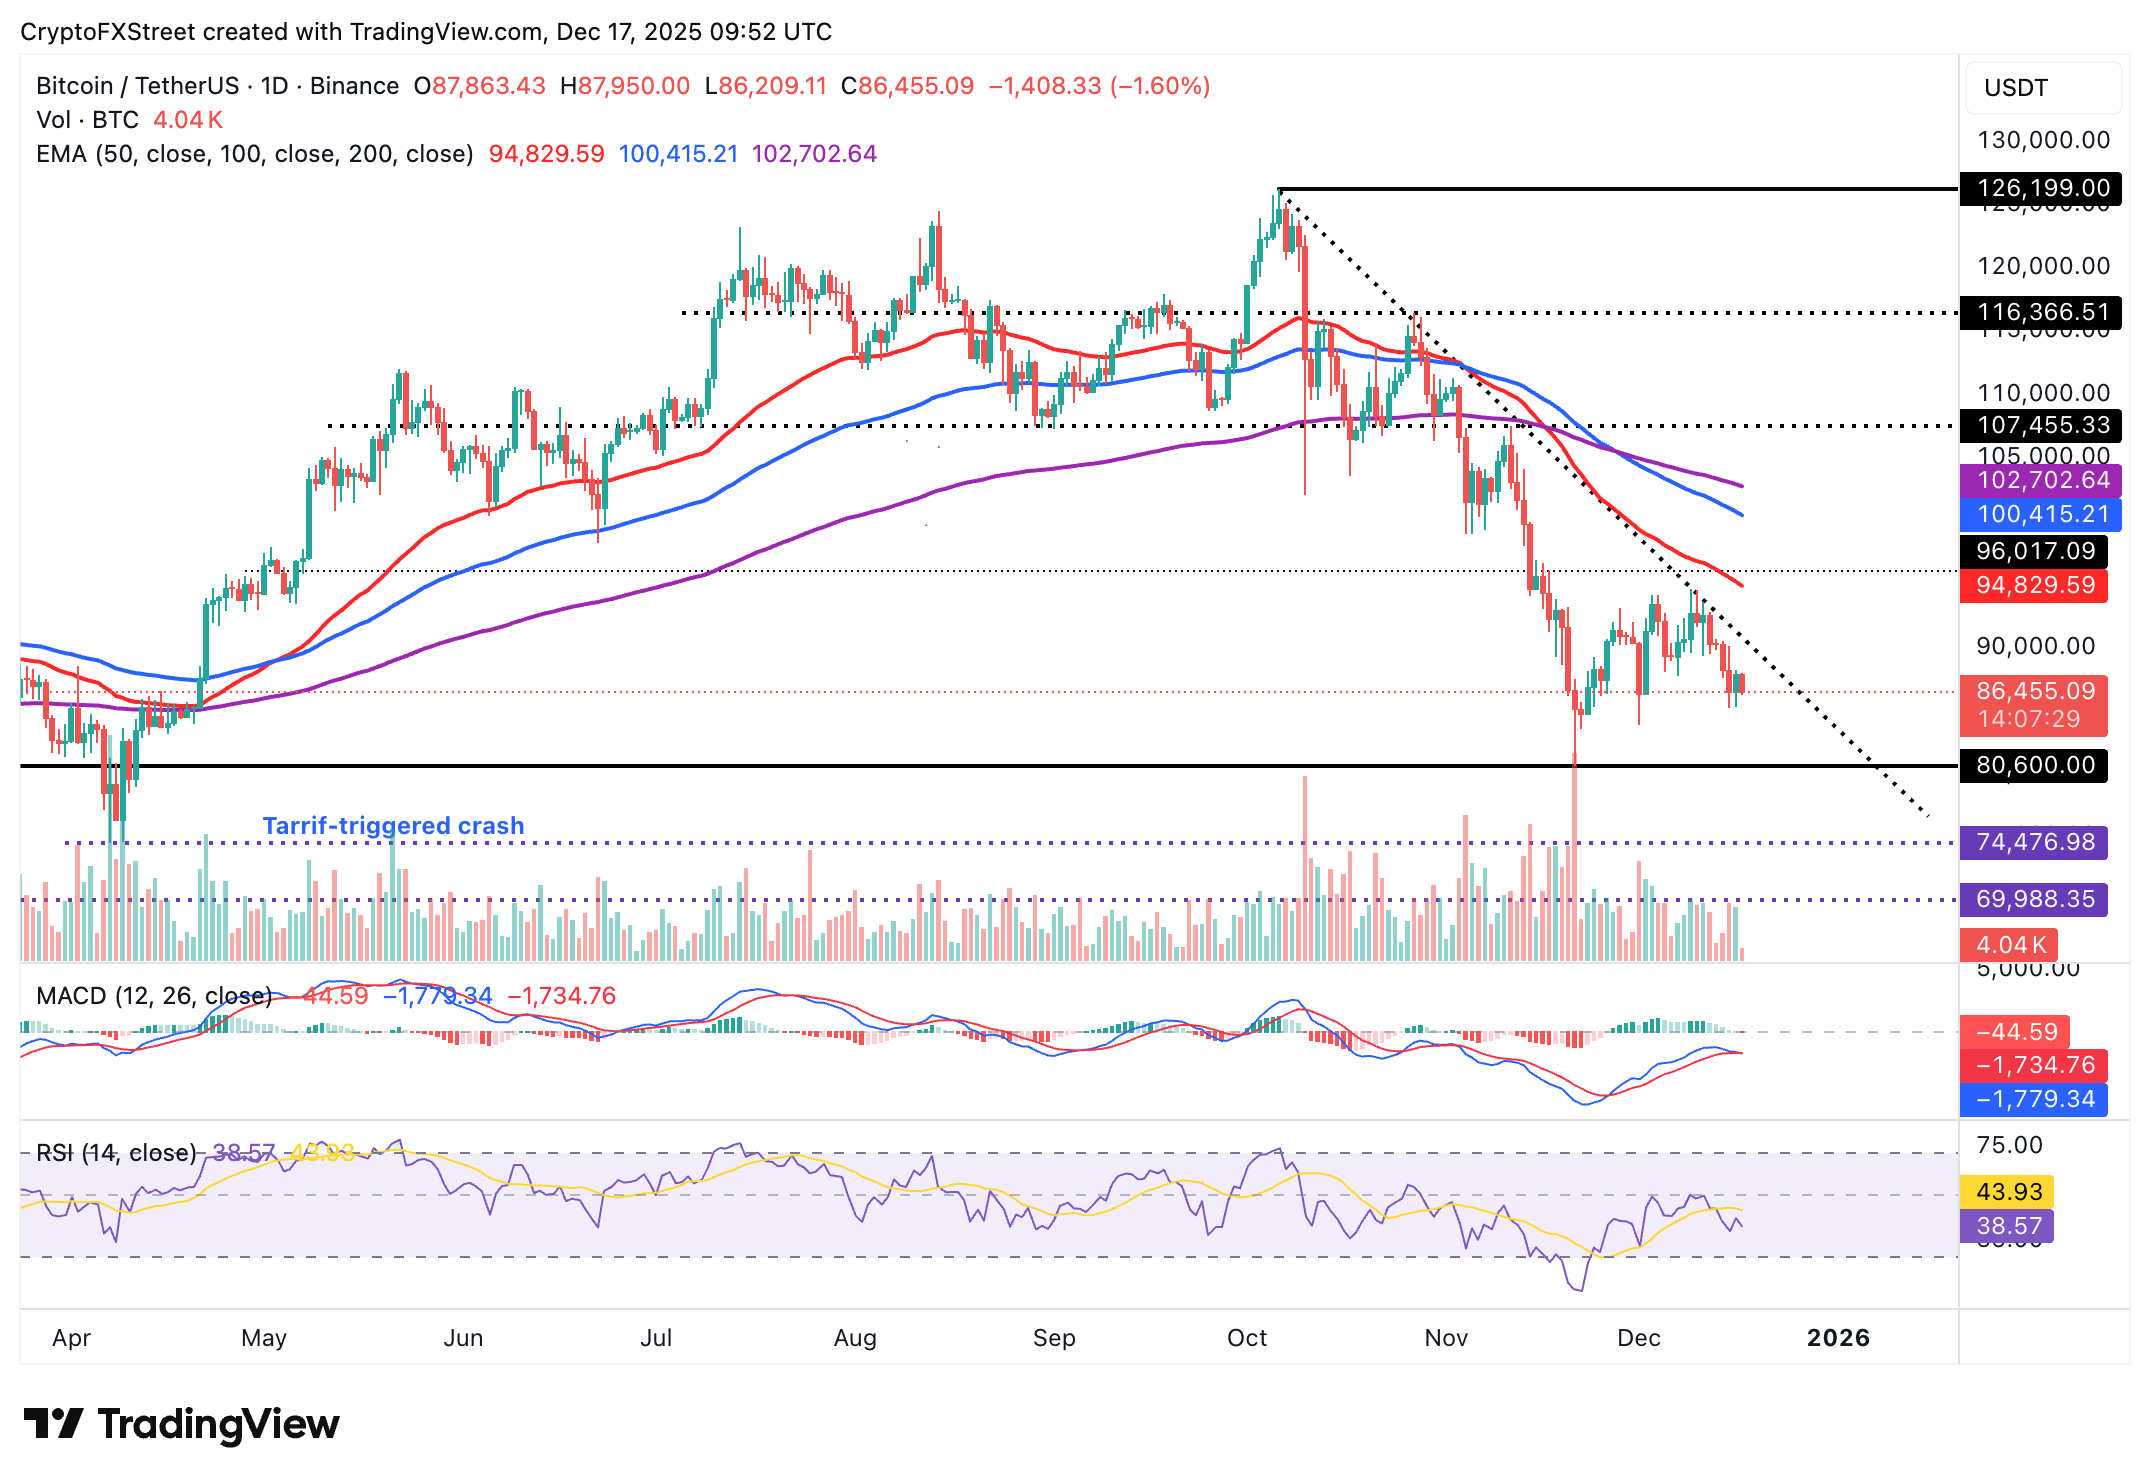
Bitcoin is hovering above $86,000 at the time of writing on Wednesday, as sellers tighten their grip across the crypto market. The downward-trending 50-day Exponential Moving Average (EMA) at $94,829, the 100-day EMA at $100,415 and the 200-day EMA at $102,702, reflect the overall bearish outlook.
The Relative Strength Index (RSI) has declined to 38, indicating downward momentum on the daily chart. A sell signal, likely to be confirmed by the Moving Average Convergence Divergence (MACD) indicator on the same chart, could prompt investors to reduce their exposure, thereby contributing to selling pressure.
Traders should watch for the blue MACD line crossing below the red signal line to confirm a sell signal. If the downtrend continues, Bitcoin may retest $80,600, a level it tested on November 21.
Altcoins update: Ethereum, XRP edge lower
Ethereum is trading above $2,900, but its upside is limited by the supply zone at $3,000. The smart contracts token also sits below the 50-day EMA at $3,248, the 200-day EMA at $3,428 and the 100-day EMA at $3,451, all of which highlight a robust bearish outlook.
A close below the short-term support at $2,900 could see ETH extending losses toward November’s low of $2,623, especially with the RSI on the daily chart falling to 40 within the bearish region.
The MACD indicator is poised to confirm a sell signal on the same chart if the blue line crosses below the red signal line. Still, a reversal above $3,000 cannot be ruled out, especially if investors buy the dip. However, the descending trendline should be broken to steady bullish momentum above the 50-day EMA at $3,248.
As for XRP, sellers are largely in control, with the price hovering below $1.90 at the time of writing on Wednesday. The RSI on the daily chart is approaching oversold territory, indicating that bearish momentum is intensifying. Meanwhile, the MACD indicator has confirmed a sell signal on the same chart, prompting investors to reduce exposure. The next key support is November’s low of $1.82, which, if broken, could accelerate the downtrend to April’s low of $1.61.
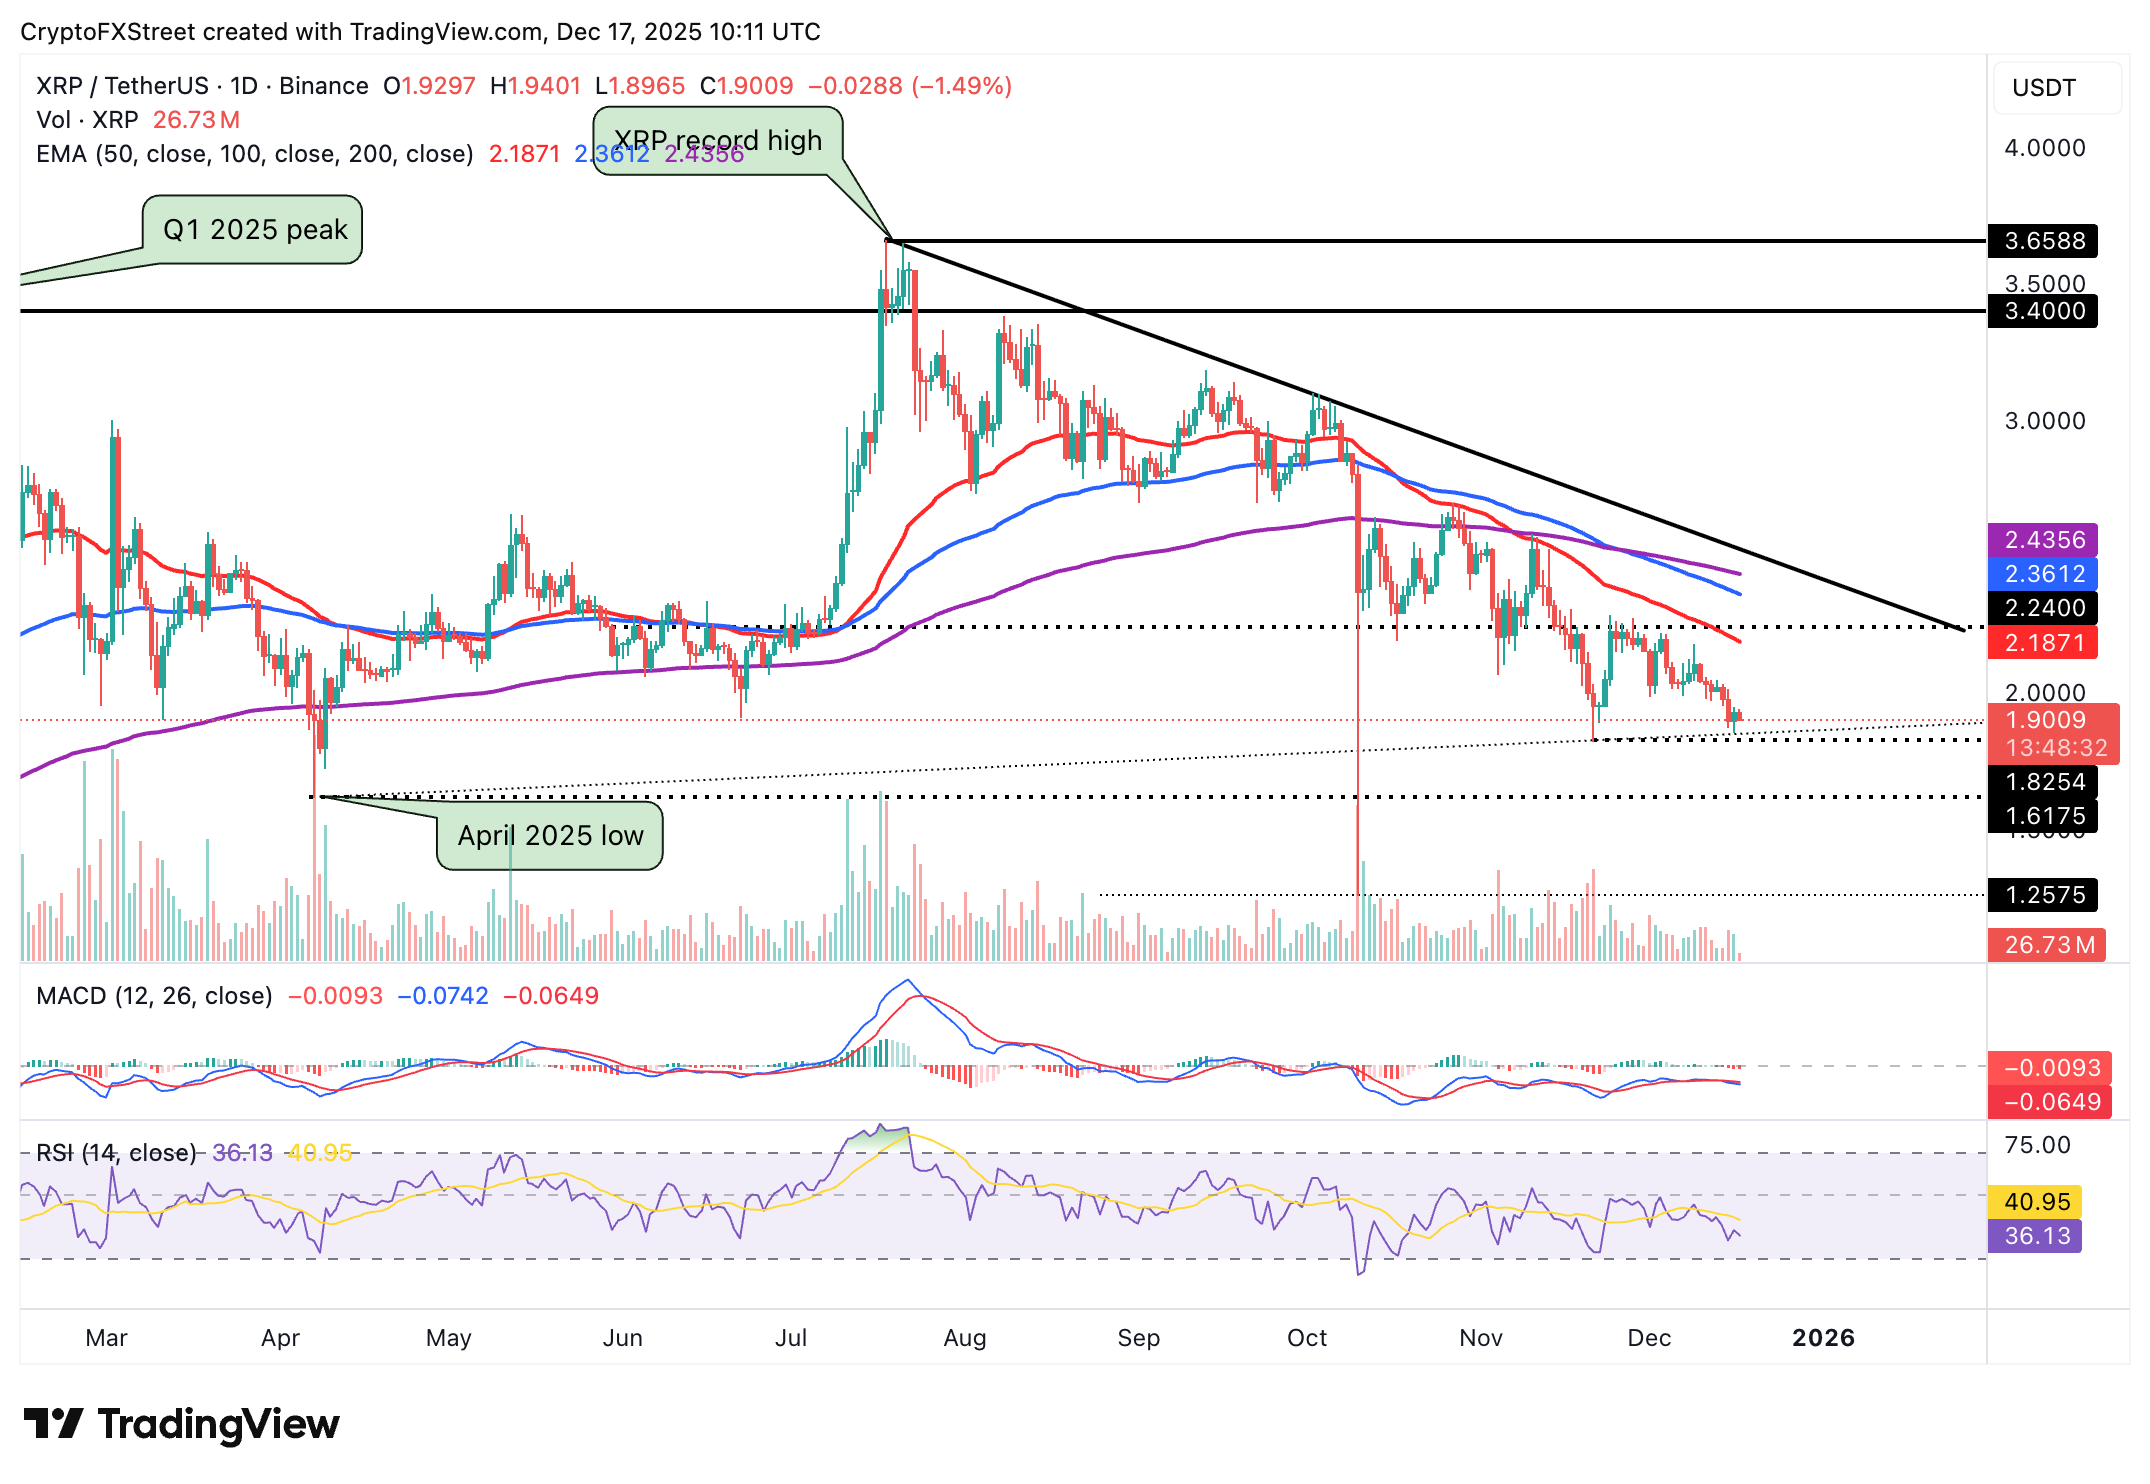
Despite the risk-off sentiment in the broader cryptocurrency market, institutional interest in XRP remains relatively steady, with ETFs’ inflows exceeding $1 billion and no outflows since their debut. Steady ETF inflows could encourage retail traders to return to the market, boosting the uptake of XRP and improving the token’s recovery potential above $2.00 in the short term.
Crypto ETF FAQs
An Exchange-Traded Fund (ETF) is an investment vehicle or an index that tracks the price of an underlying asset. ETFs can not only track a single asset, but a group of assets and sectors. For example, a Bitcoin ETF tracks Bitcoin’s price. ETF is a tool used by investors to gain exposure to a certain asset.
Yes. The first Bitcoin futures ETF in the US was approved by the US Securities & Exchange Commission in October 2021. A total of seven Bitcoin futures ETFs have been approved, with more than 20 still waiting for the regulator’s permission. The SEC says that the cryptocurrency industry is new and subject to manipulation, which is why it has been delaying crypto-related futures ETFs for the last few years.
Yes. The SEC approved in January 2024 the listing and trading of several Bitcoin spot Exchange-Traded Funds, opening the door to institutional capital and mainstream investors to trade the main crypto currency. The decision was hailed by the industry as a game changer.
The main advantage of crypto ETFs is the possibility of gaining exposure to a cryptocurrency without ownership, reducing the risk and cost of holding the asset. Other pros are a lower learning curve and higher security for investors since ETFs take charge of securing the underlying asset holdings. As for the main drawbacks, the main one is that as an investor you can’t have direct ownership of the asset, or, as they say in crypto, “not your keys, not your coins.” Other disadvantages are higher costs associated with holding crypto since ETFs charge fees for active management. Finally, even though investing in ETFs reduces the risk of holding an asset, price swings in the underlying cryptocurrency are likely to be reflected in the investment vehicle too.
บทความแนะนำ


