


Crypto Today: Bitcoin, Ethereum, XRP flash subtle recovery signs
- Bitcoin rises above $91,000 as short-term technical indicators show fading bearish momentum.
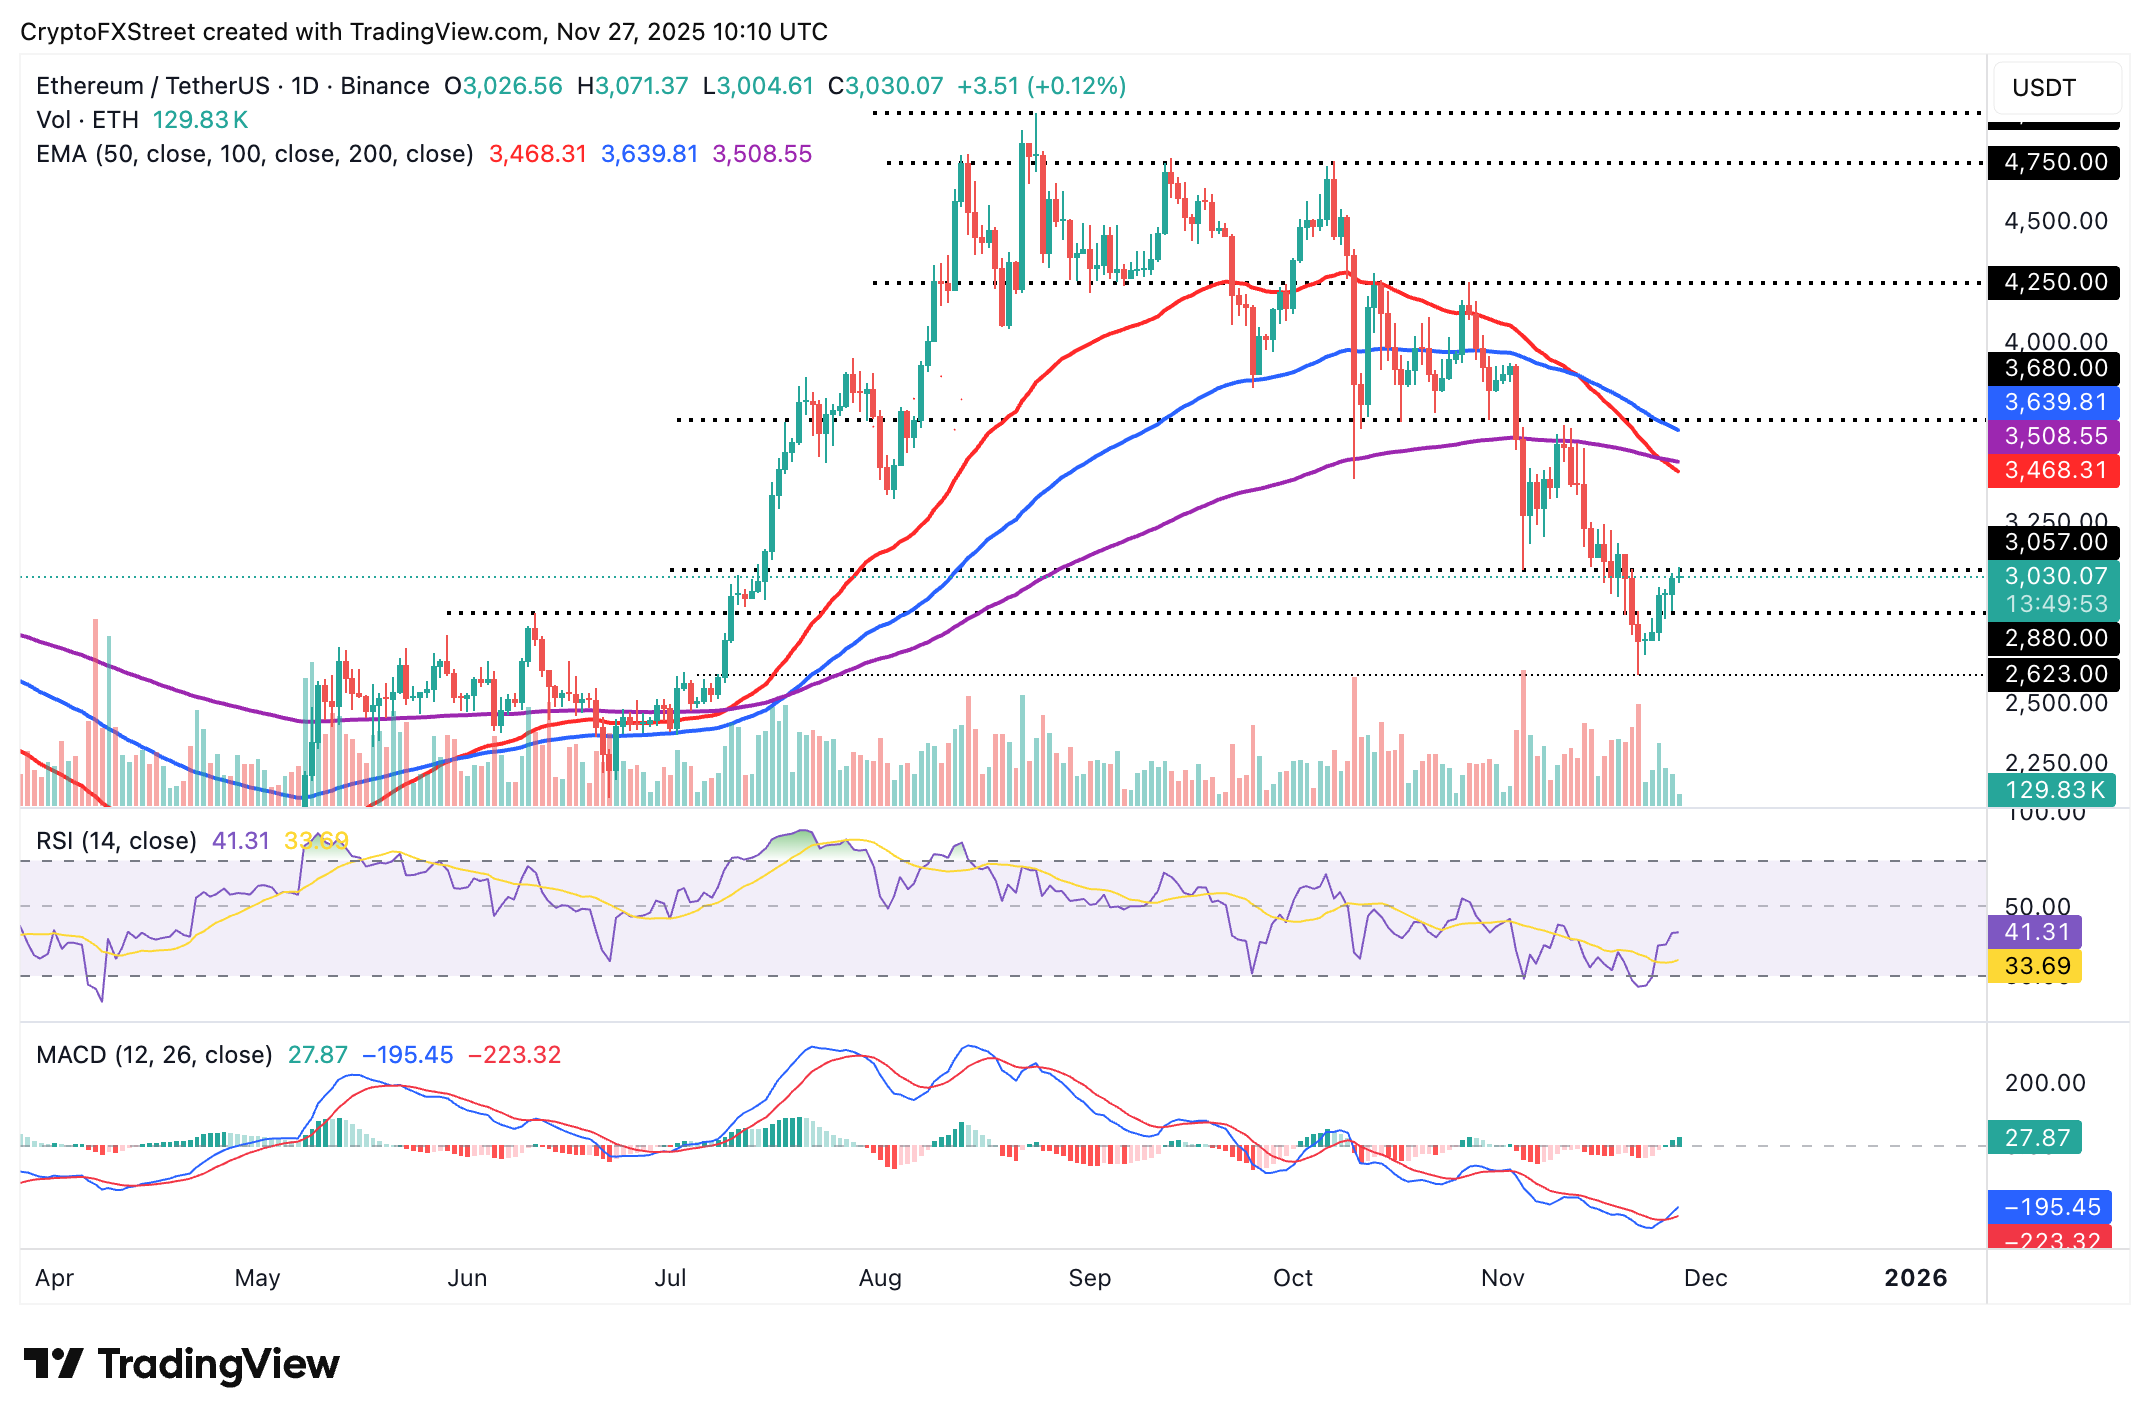
- Ethereum reclaims $3,000 support despite Death Cross patterns on the daily chart.
- XRP trades under pressure, with momentum capped under $2.30.
Bitcoin (BTC) is rising above $91,000 at the time of writing on Thursday, supported by growing investor interest in the broader cryptocurrency market. Ethereum (ETH) has extended its up leg above $3,000, as technical indicators signal easing bearish momentum. Ripple (XRP), on the other hand, is capped under resistance at $2.30 despite inflows into spot Exchange Traded Funds (ETFs).
Data spotlight: Bitcoin, Ethereum, XRP extend ETF inflows
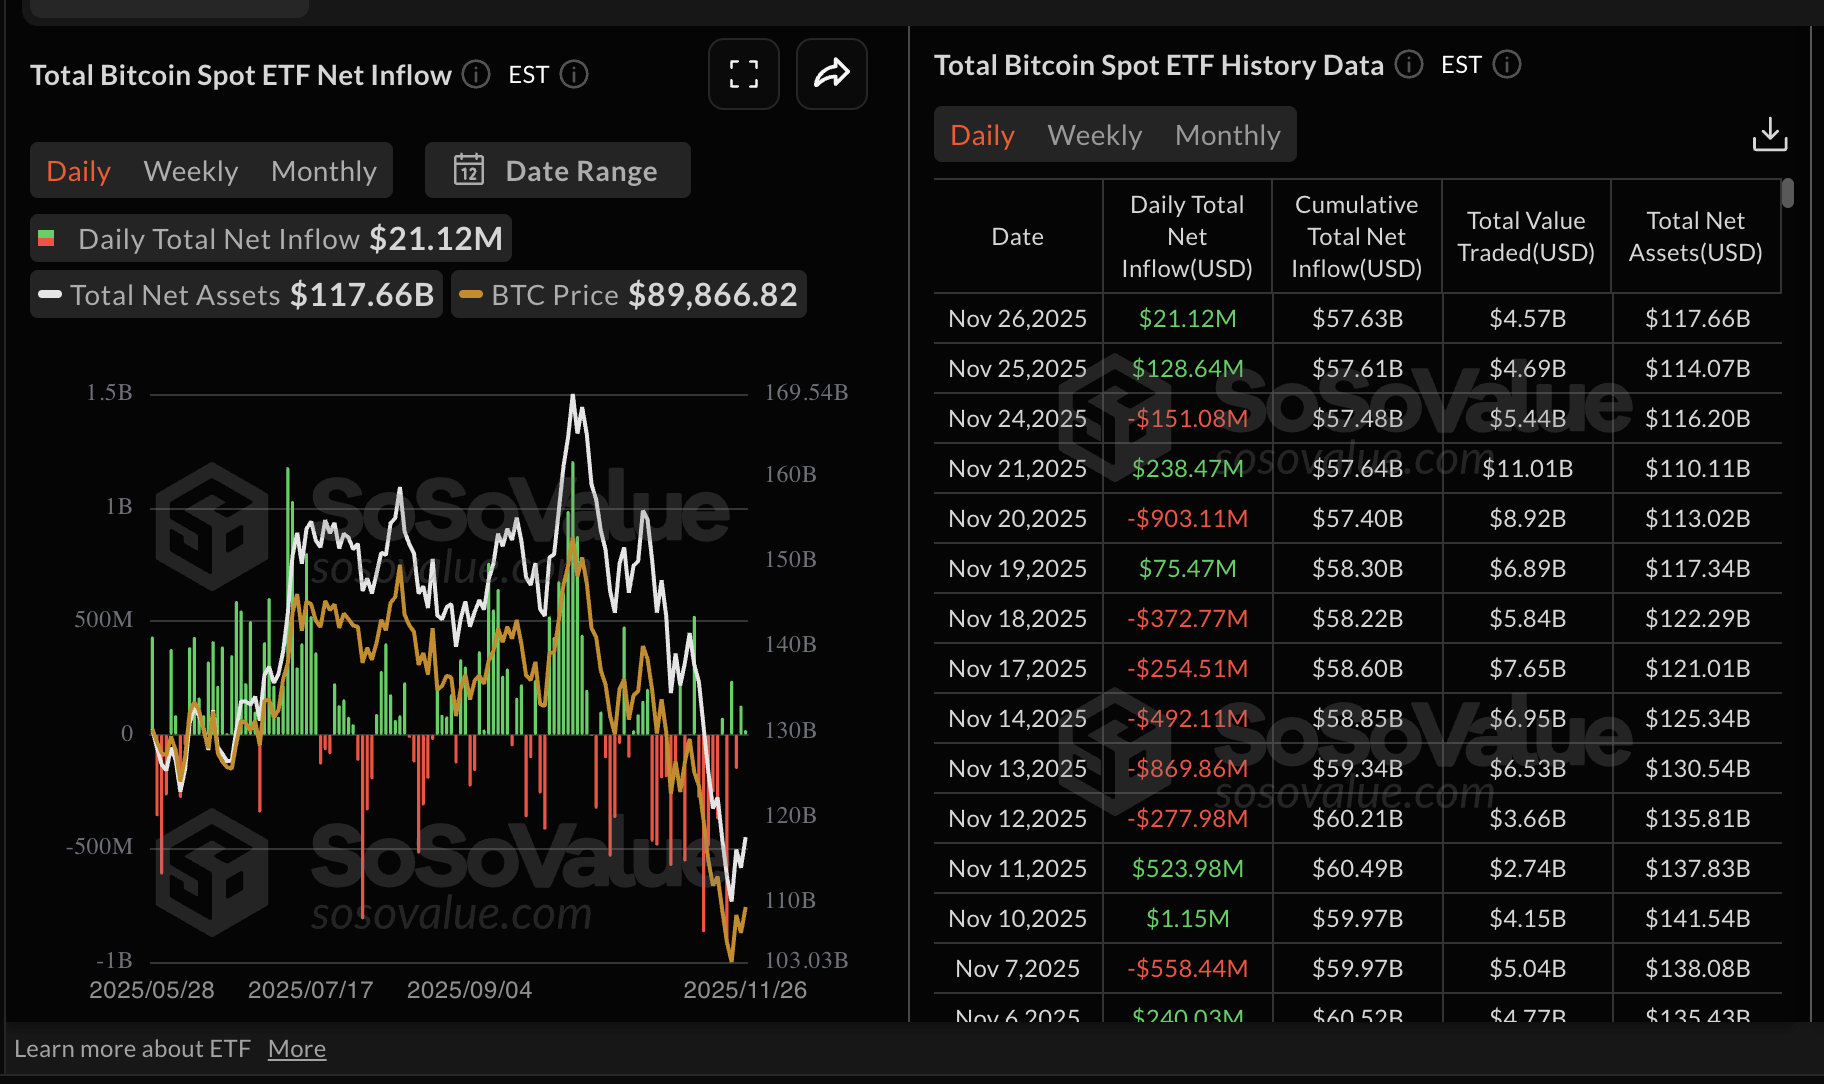
Bitcoin ETFs listed in the United States (US) experienced inflows on Wednesday, reflecting improving risk appetite among institutional investors. SoSoValue data shows that Bitcoin recorded mild ETF inflows, totaling $21 million on Wednesday, pointing to a subtle return of institutional investors.
However, macroeconomic uncertainty, concerns about the Federal Reserve's (Fed) December monetary policy decision, and a lack of conviction in the market's ability to sustain the recovery continue to undermine investor confidence while accentuating risk-off sentiment.
ETF inflows must steadily increase to support positive sentiment and increase the odds of a steady uptrend targeting highs above $100,000.
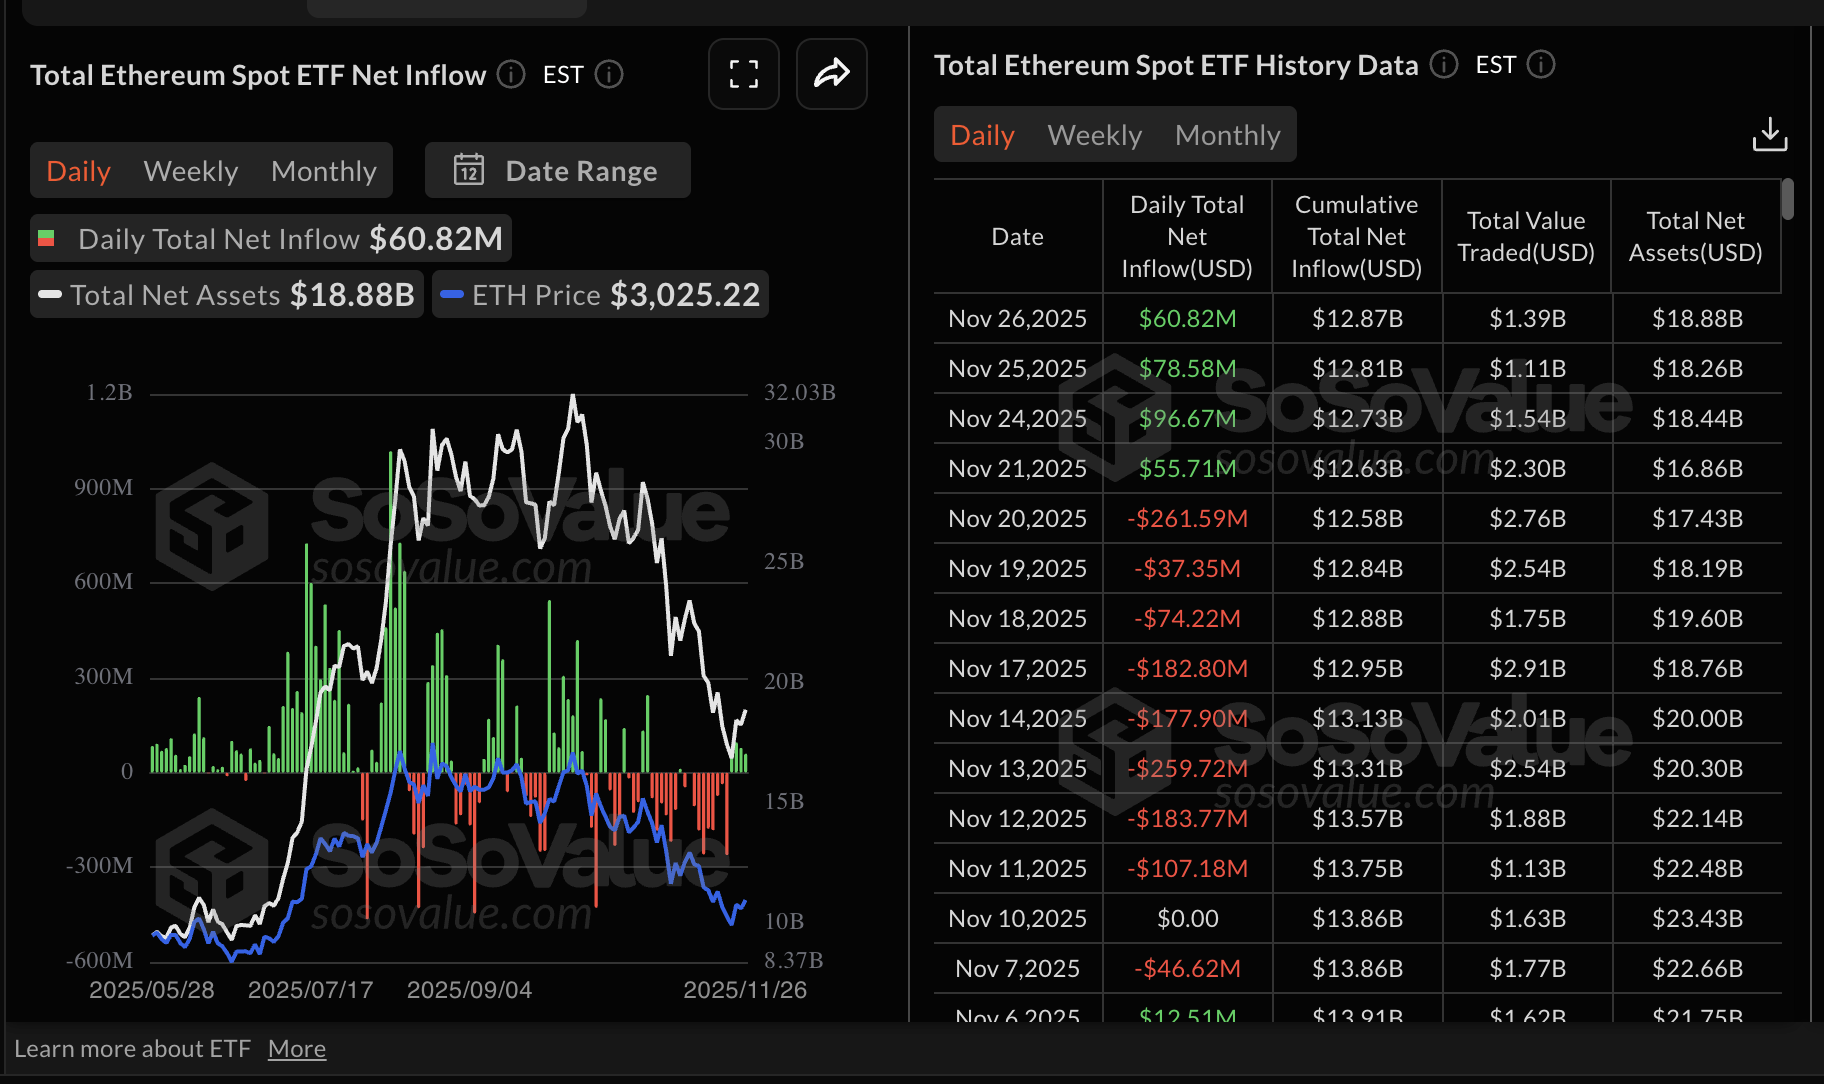
Ethereum ETFs, on the other hand, experienced their fourth consecutive day of inflows, with nearly $61 million recorded on Wednesday, $79 million on Tuesday, $97 million on Monday, and $56 million on Friday. The cumulative inflow volume totals $12.87 billion as of Wednesday, with net assets of $18.88 billion.
XRP ETFs recorded nearly $22 million in inflows on Wednesday, bringing the cumulative net volume to approximately $644 million and net assets to $676 million. The steady inflows, now on their ninth consecutive day, indicate that institutional investors are paying attention to altcoin-based ETFs.
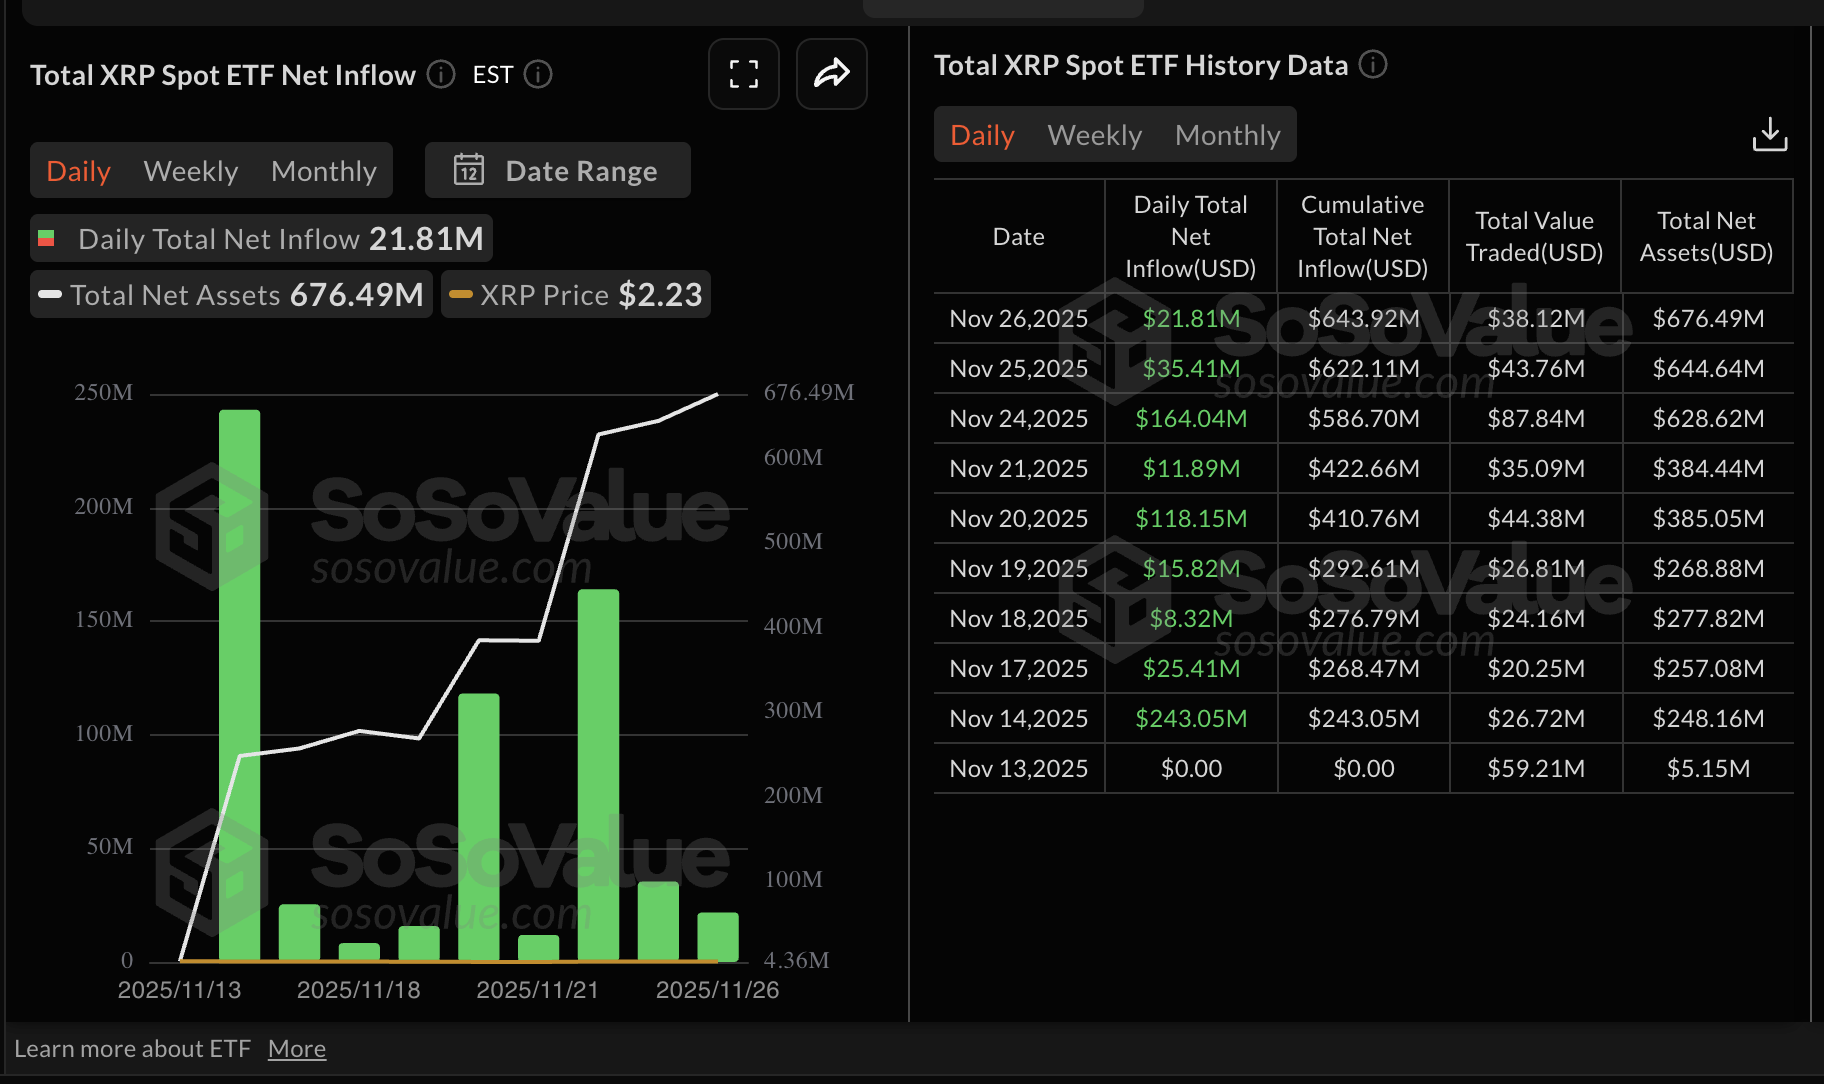
Chart of the day: Bitcoin rises amid easing bearish momentum
Bitcoin is edging closer to $92,000 at the time of writing on Thursday, supported by an upward-trending Relative Strength Index (RSI) at 42 on the daily chart.
Bullish momentum will likely surge if the RSI lifts above the 50 midline, increasing the chances of closing the gap to $100,000.
The Moving Average Convergence Divergence (MACD) indicator has confirmed a buy signal on the same daily chart. Investors will consider increasing their risk exposure if the blue MACD line remains above the red signal line while the indicator continues to rise. The green histogram expanding above the zero line underpins increasing bullish momentum.
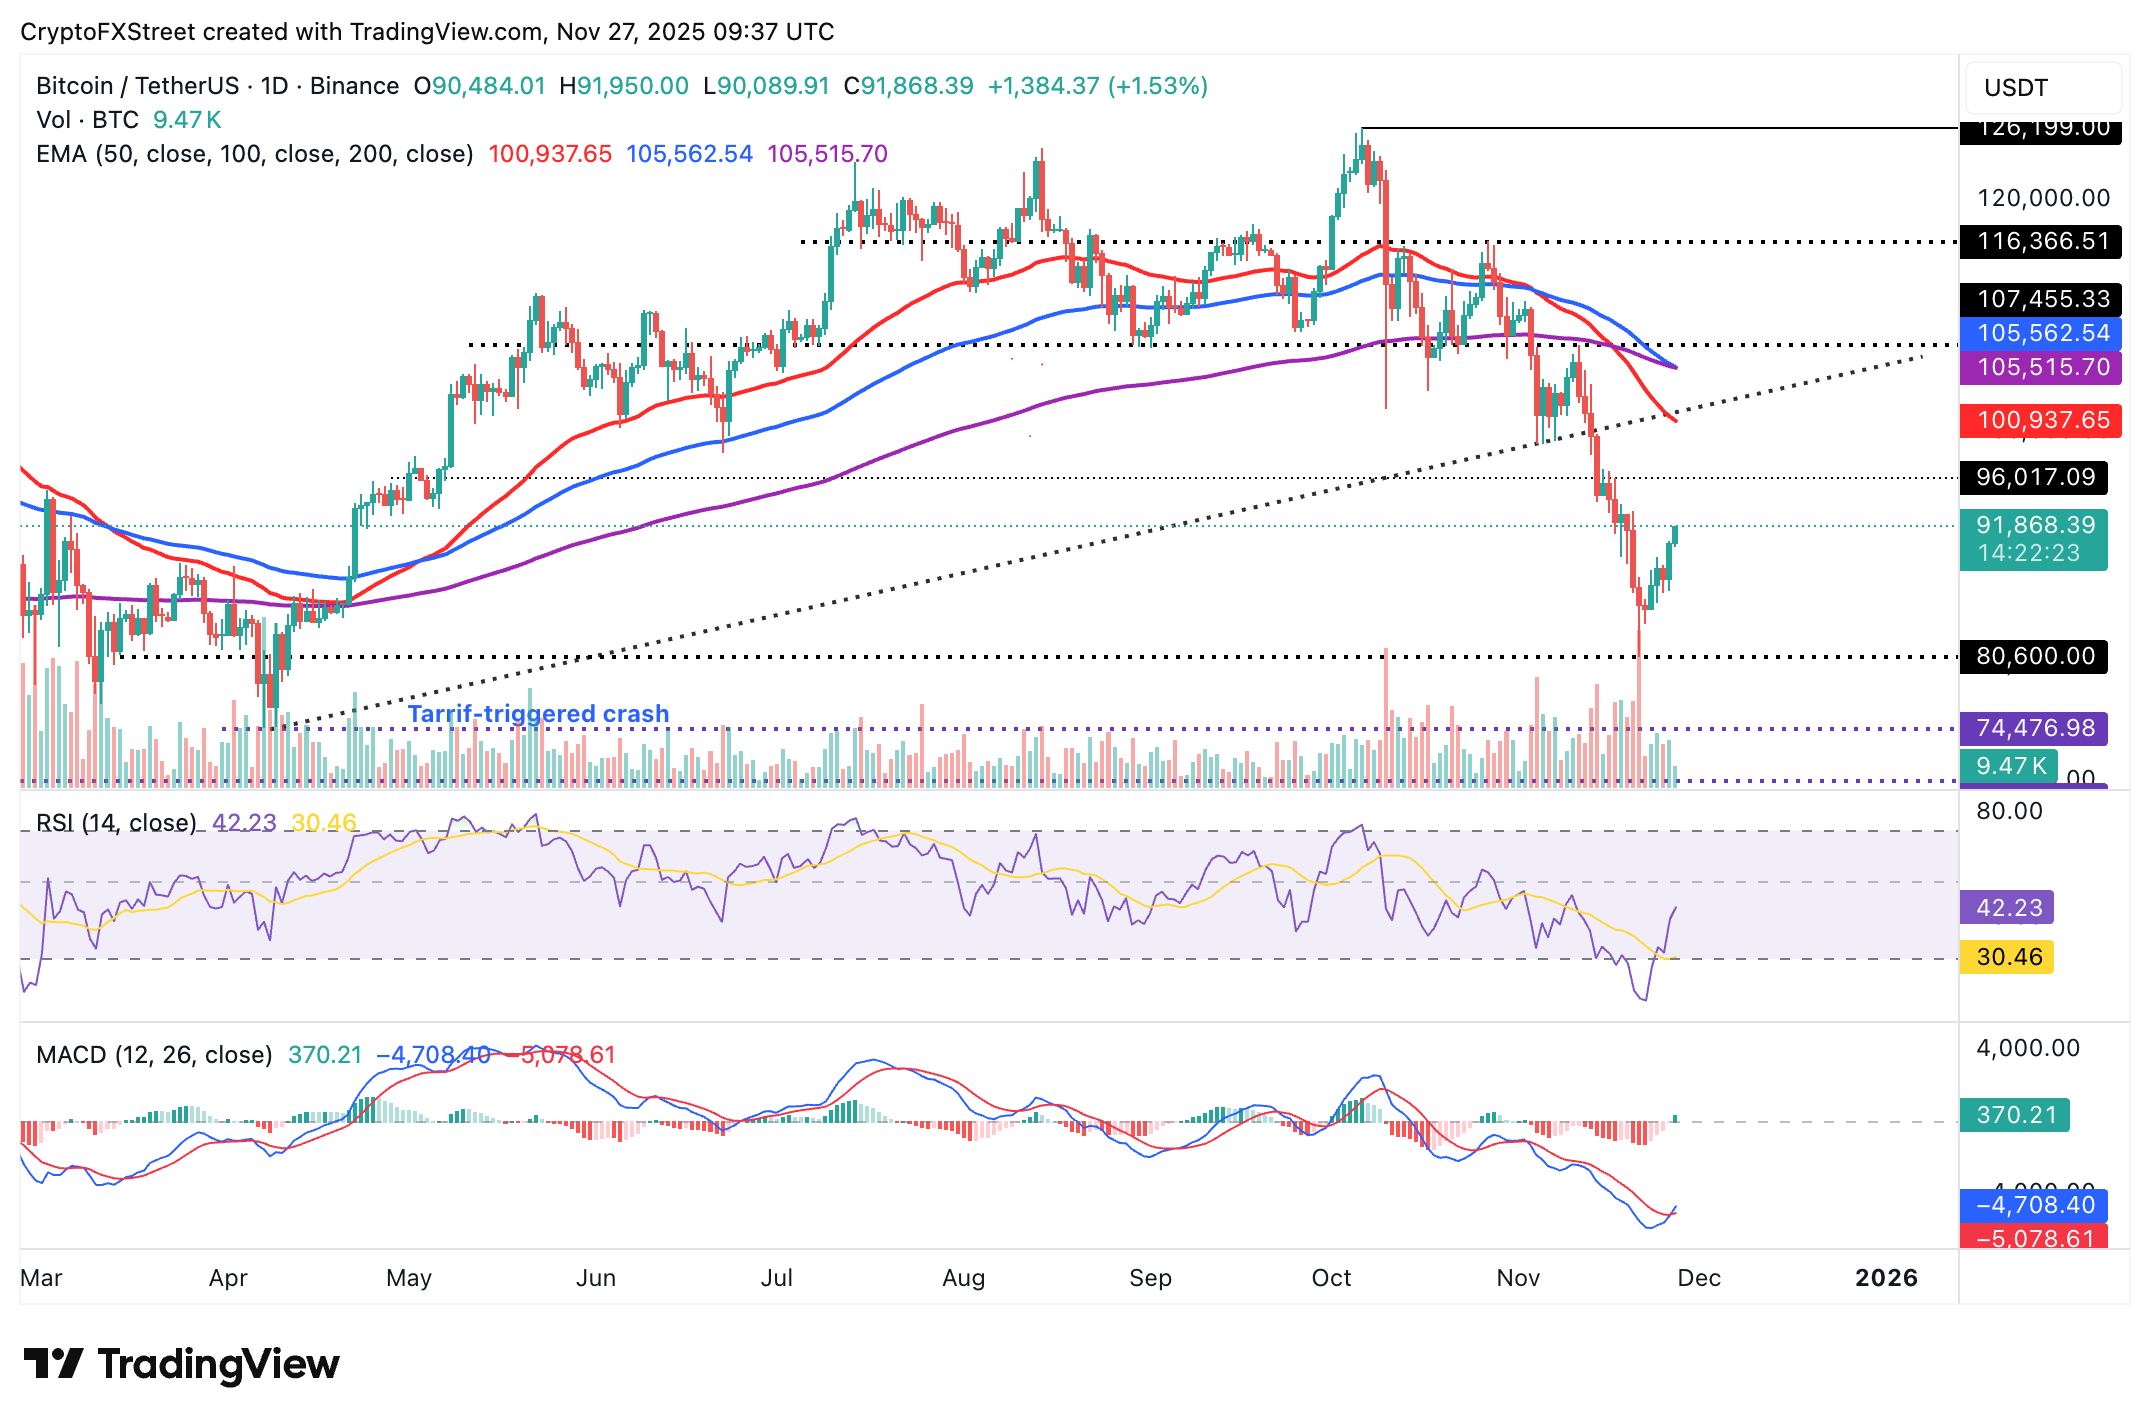
Still, Bitcoin is tracing under pressure, with a downward-sloping 50-day Exponential Moving Average (EMA) at $100,937, the 200-day EMA at $105,515 and the 100-day EMA at $105,562, capping rebounds. Losses below $90,000 may persist unless BTC reclaims the 50-day EMA as support.
Altcoins update: Ethereum, XRP send mixed signals
Ethereum is holding above $3,000 at the time of writing on Thursday, as bulls push to reclaim control. The RSI has risen to 41 from the oversold region on the daily chart, indicating that bearish momentum is narrowing and that ETH bulls could push toward the 50-day EMA at $3,468.
At the same time, the MACD indicator triggered a buy signal on Wednesday, encouraging investors to increase their risk exposure. A steady uptrend is required above the zero line to reinforce the bullish grip.
However, two Death Cross patterns on the same daily chart signal that the bearish outlook is still apparent and may continue weighing Ethereum down. A Death Cross pattern forms when a shorter-term moving average crosses and settles below a longer-term moving average, as observed on the daily chart.
As for XRP, recovery remains a pipe dream, with the price capped under resistance at $2.30. The RSI is stable at 46, indicating a lack of momentum and suggesting that sideways trading may prevail in the short term.
A decline in the RSI toward the oversold region would indicate that bearish momentum is increasing. Key areas of interest for traders are the next supply zone at $2.07, which was tested on Friday, and the round-number support at $2.00.
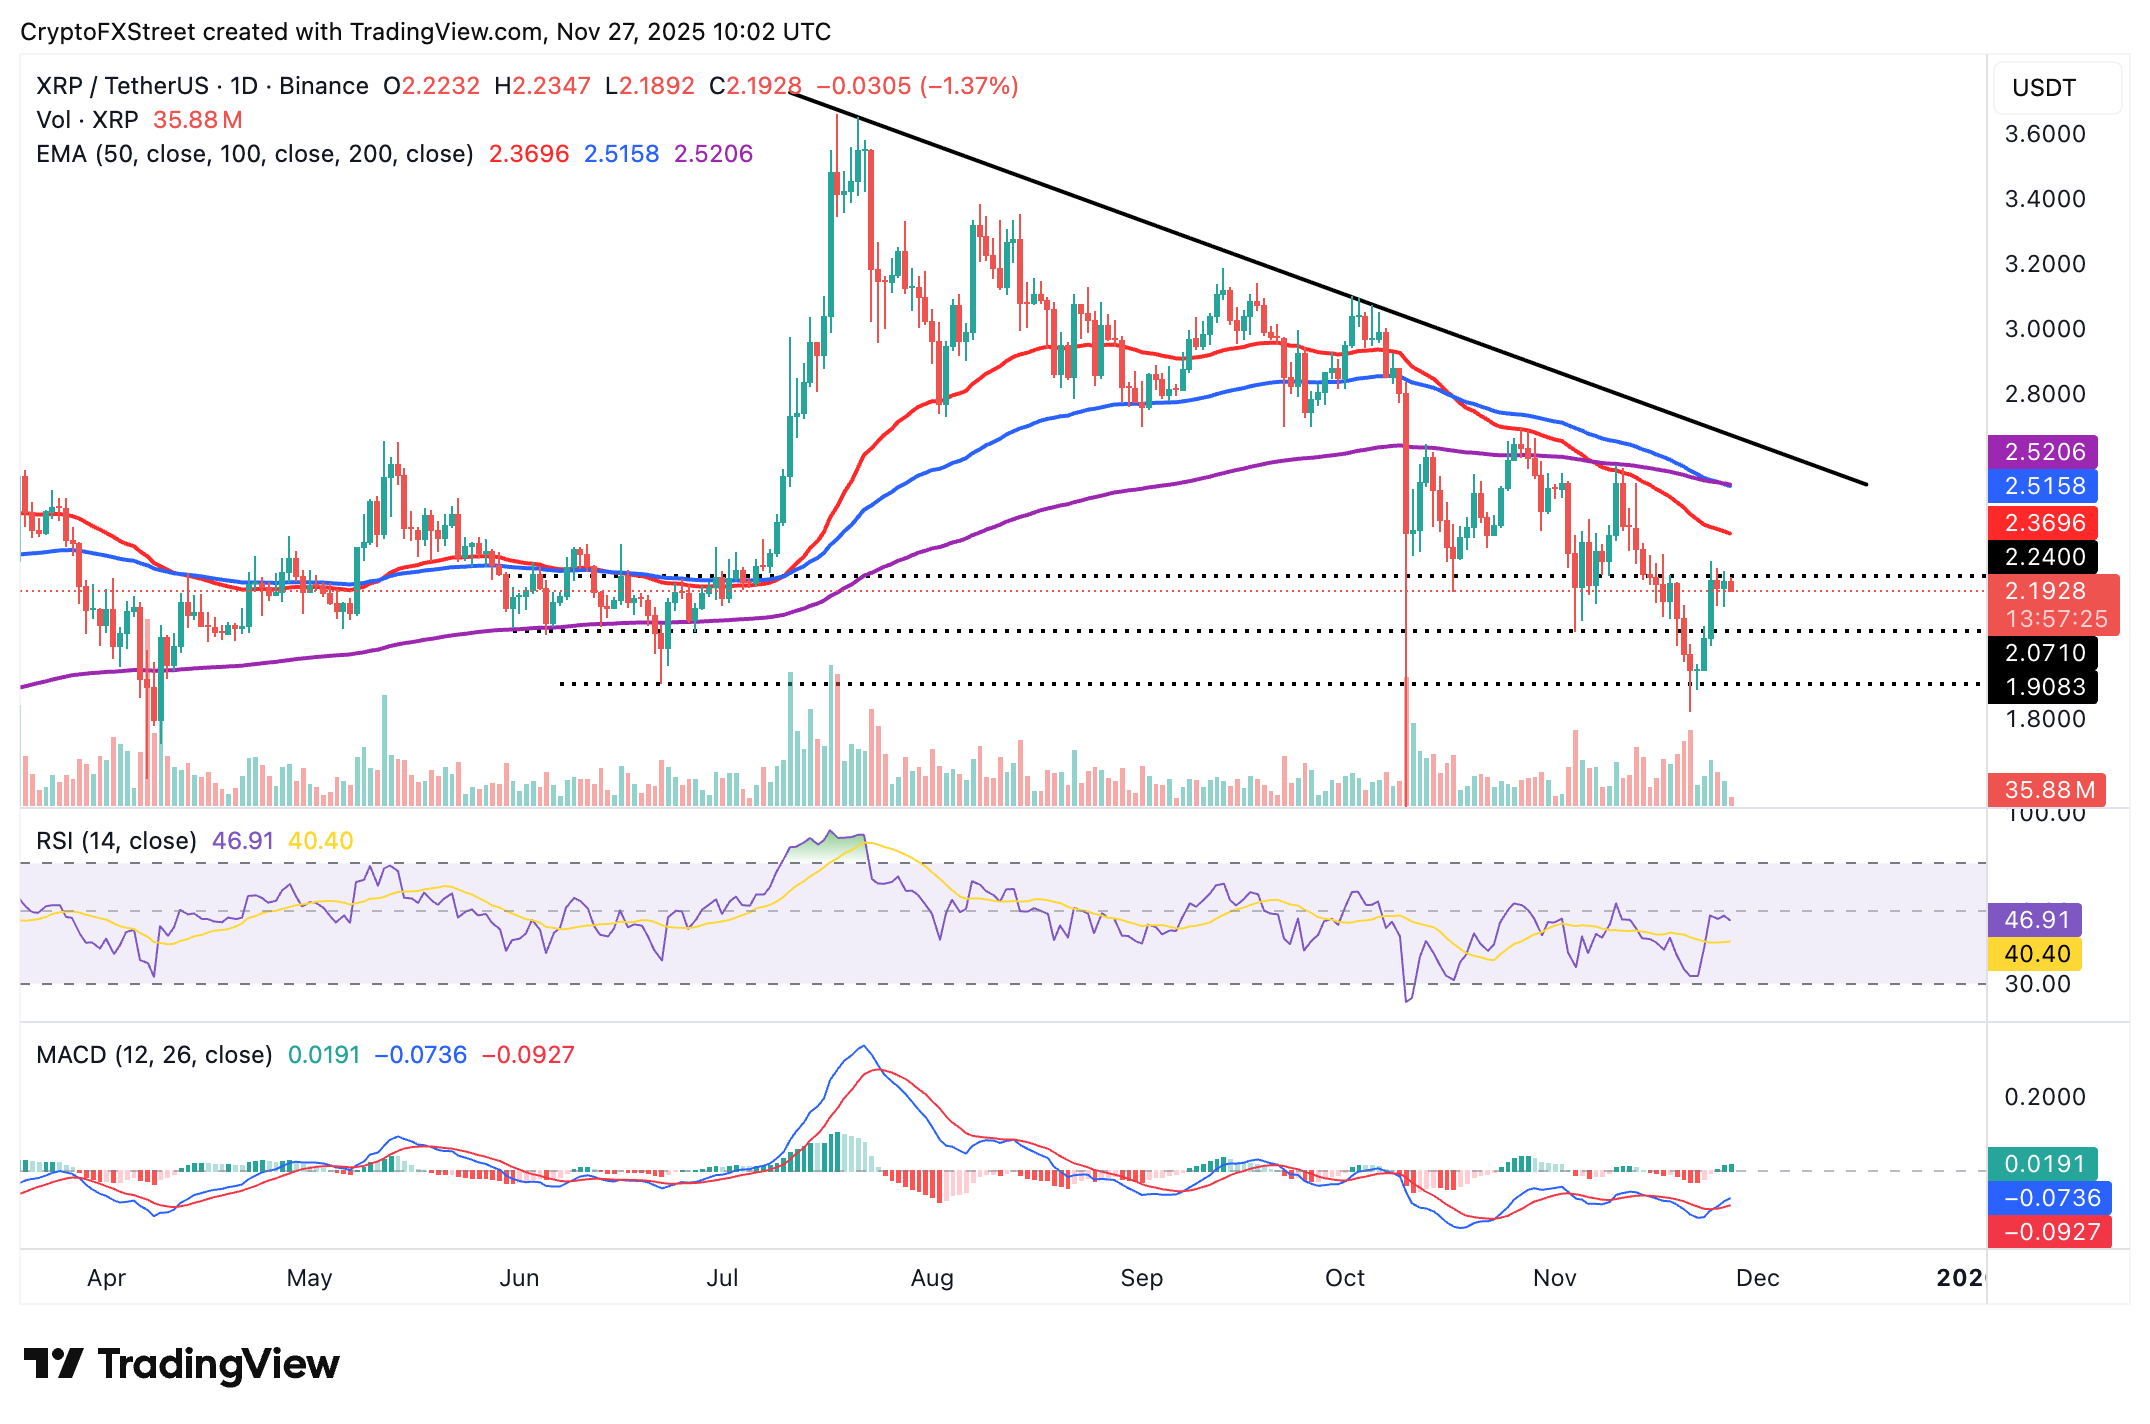
Still, the MACD indicator is showcasing a buy signal confirmed on Tuesday when the blue line crossed above the red signal line. The path of least resistance will remain upward toward the 50-day EMA at $2.36 if the MACD indicator rebounds above the mean line while the green histogram bars expand.
Crypto ETF FAQs
An Exchange-Traded Fund (ETF) is an investment vehicle or an index that tracks the price of an underlying asset. ETFs can not only track a single asset, but a group of assets and sectors. For example, a Bitcoin ETF tracks Bitcoin’s price. ETF is a tool used by investors to gain exposure to a certain asset.
Yes. The first Bitcoin futures ETF in the US was approved by the US Securities & Exchange Commission in October 2021. A total of seven Bitcoin futures ETFs have been approved, with more than 20 still waiting for the regulator’s permission. The SEC says that the cryptocurrency industry is new and subject to manipulation, which is why it has been delaying crypto-related futures ETFs for the last few years.
Yes. The SEC approved in January 2024 the listing and trading of several Bitcoin spot Exchange-Traded Funds, opening the door to institutional capital and mainstream investors to trade the main crypto currency. The decision was hailed by the industry as a game changer.
The main advantage of crypto ETFs is the possibility of gaining exposure to a cryptocurrency without ownership, reducing the risk and cost of holding the asset. Other pros are a lower learning curve and higher security for investors since ETFs take charge of securing the underlying asset holdings. As for the main drawbacks, the main one is that as an investor you can’t have direct ownership of the asset, or, as they say in crypto, “not your keys, not your coins.” Other disadvantages are higher costs associated with holding crypto since ETFs charge fees for active management. Finally, even though investing in ETFs reduces the risk of holding an asset, price swings in the underlying cryptocurrency are likely to be reflected in the investment vehicle too.
บทความแนะนำ


