


Solana Price Forecast: SOL builds recovery muscle on steady ETF inflows
- Solana rises above $142, despite the bearish sentiment in the broader cryptocurrency market.
- Institutional investors turn to altcoins as SOL ETF posts nearly $56 million in inflows.
- SOL has been testing a key support area since mid-June, amid decreasing bearish momentum.
Solana (SOL) is trading above $141 at the time of writing on Thursday. The general outlook remains bearish despite a knee-jerk recovery from $130, which marked the previous day's low.
Solana extends ETF inflows
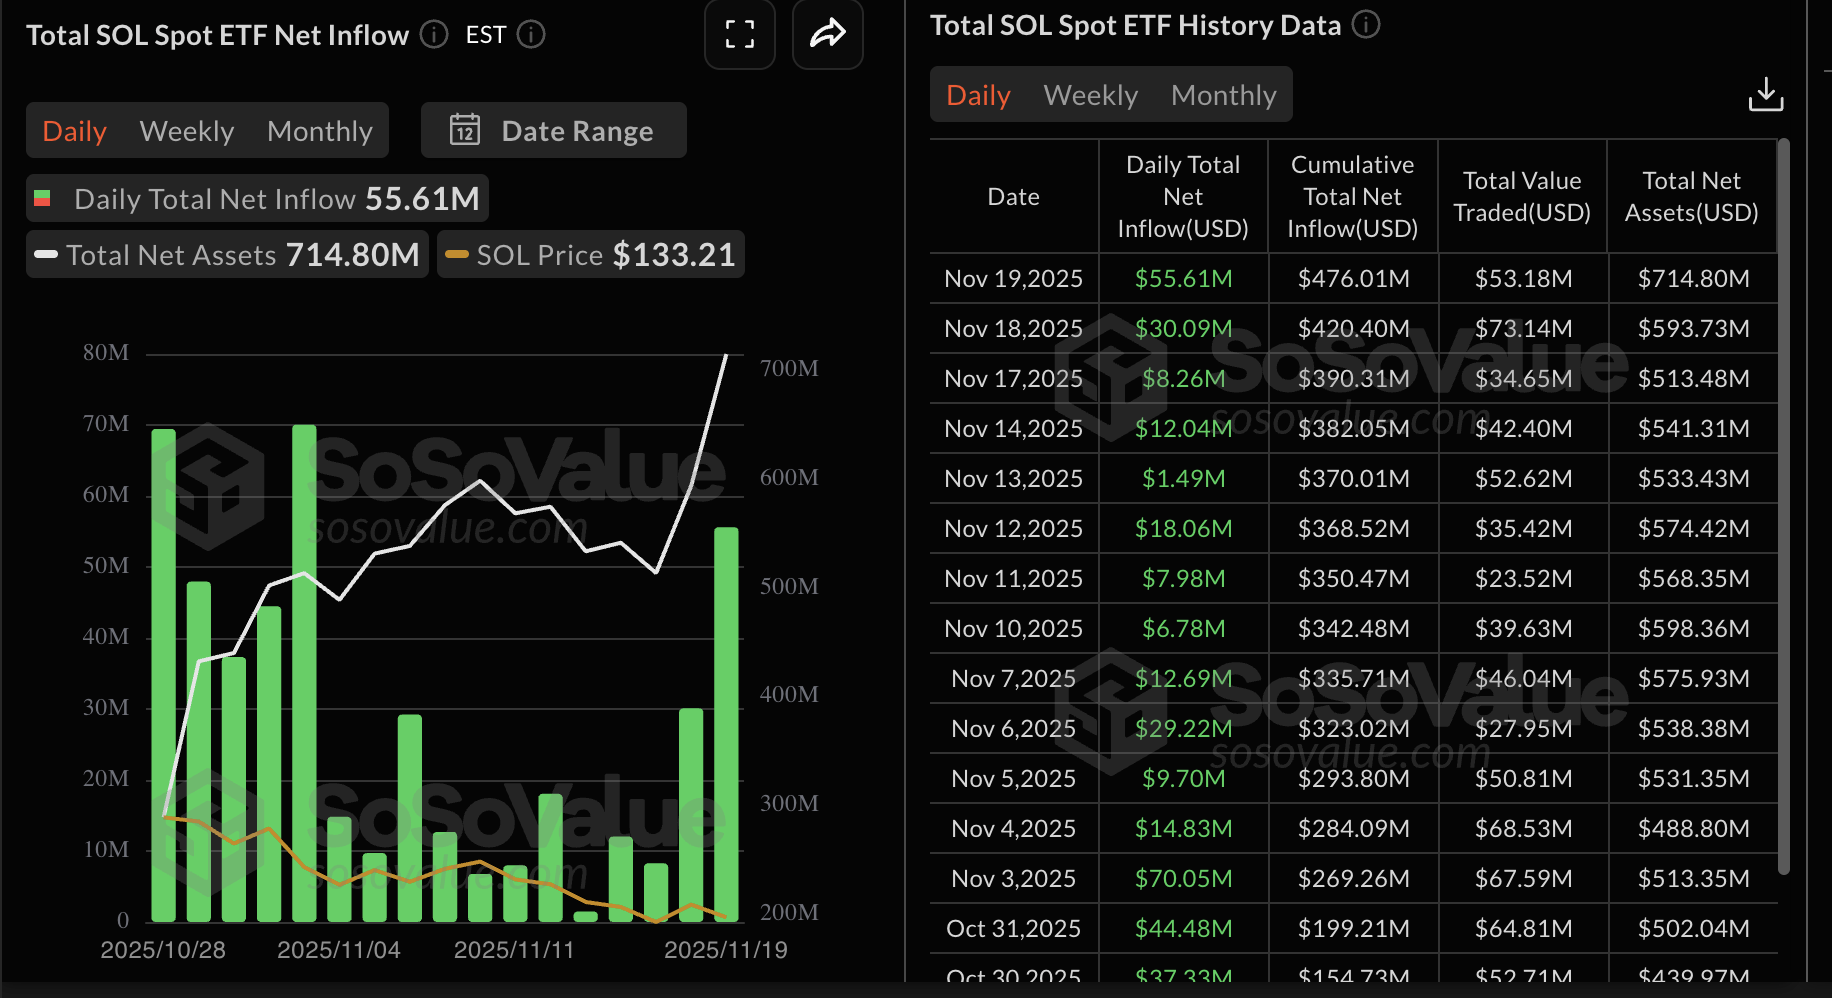
Solana is experiencing steady inflows into Exchange Traded Funds (ETFs). According to SoSo data, US-listed SOL ETFs recorded inflows of nearly $56 million on Wednesday, bringing cumulative net inflows to $476 million.
Bitwise's BSOL ETF was the best-performing product, with approximately $36 million in inflows, followed by Grayscale's GSOL with nearly $13 million and Fidelity's FSOL with $5 million.
Solana ETFs have not experienced outflows since their October 28 debut, underscoring the growing interest in altcoin investment products.
On the other hand, retail demand has not picked up since mid-October, when the cryptocurrency market experienced one of its largest single-day liquidation events.
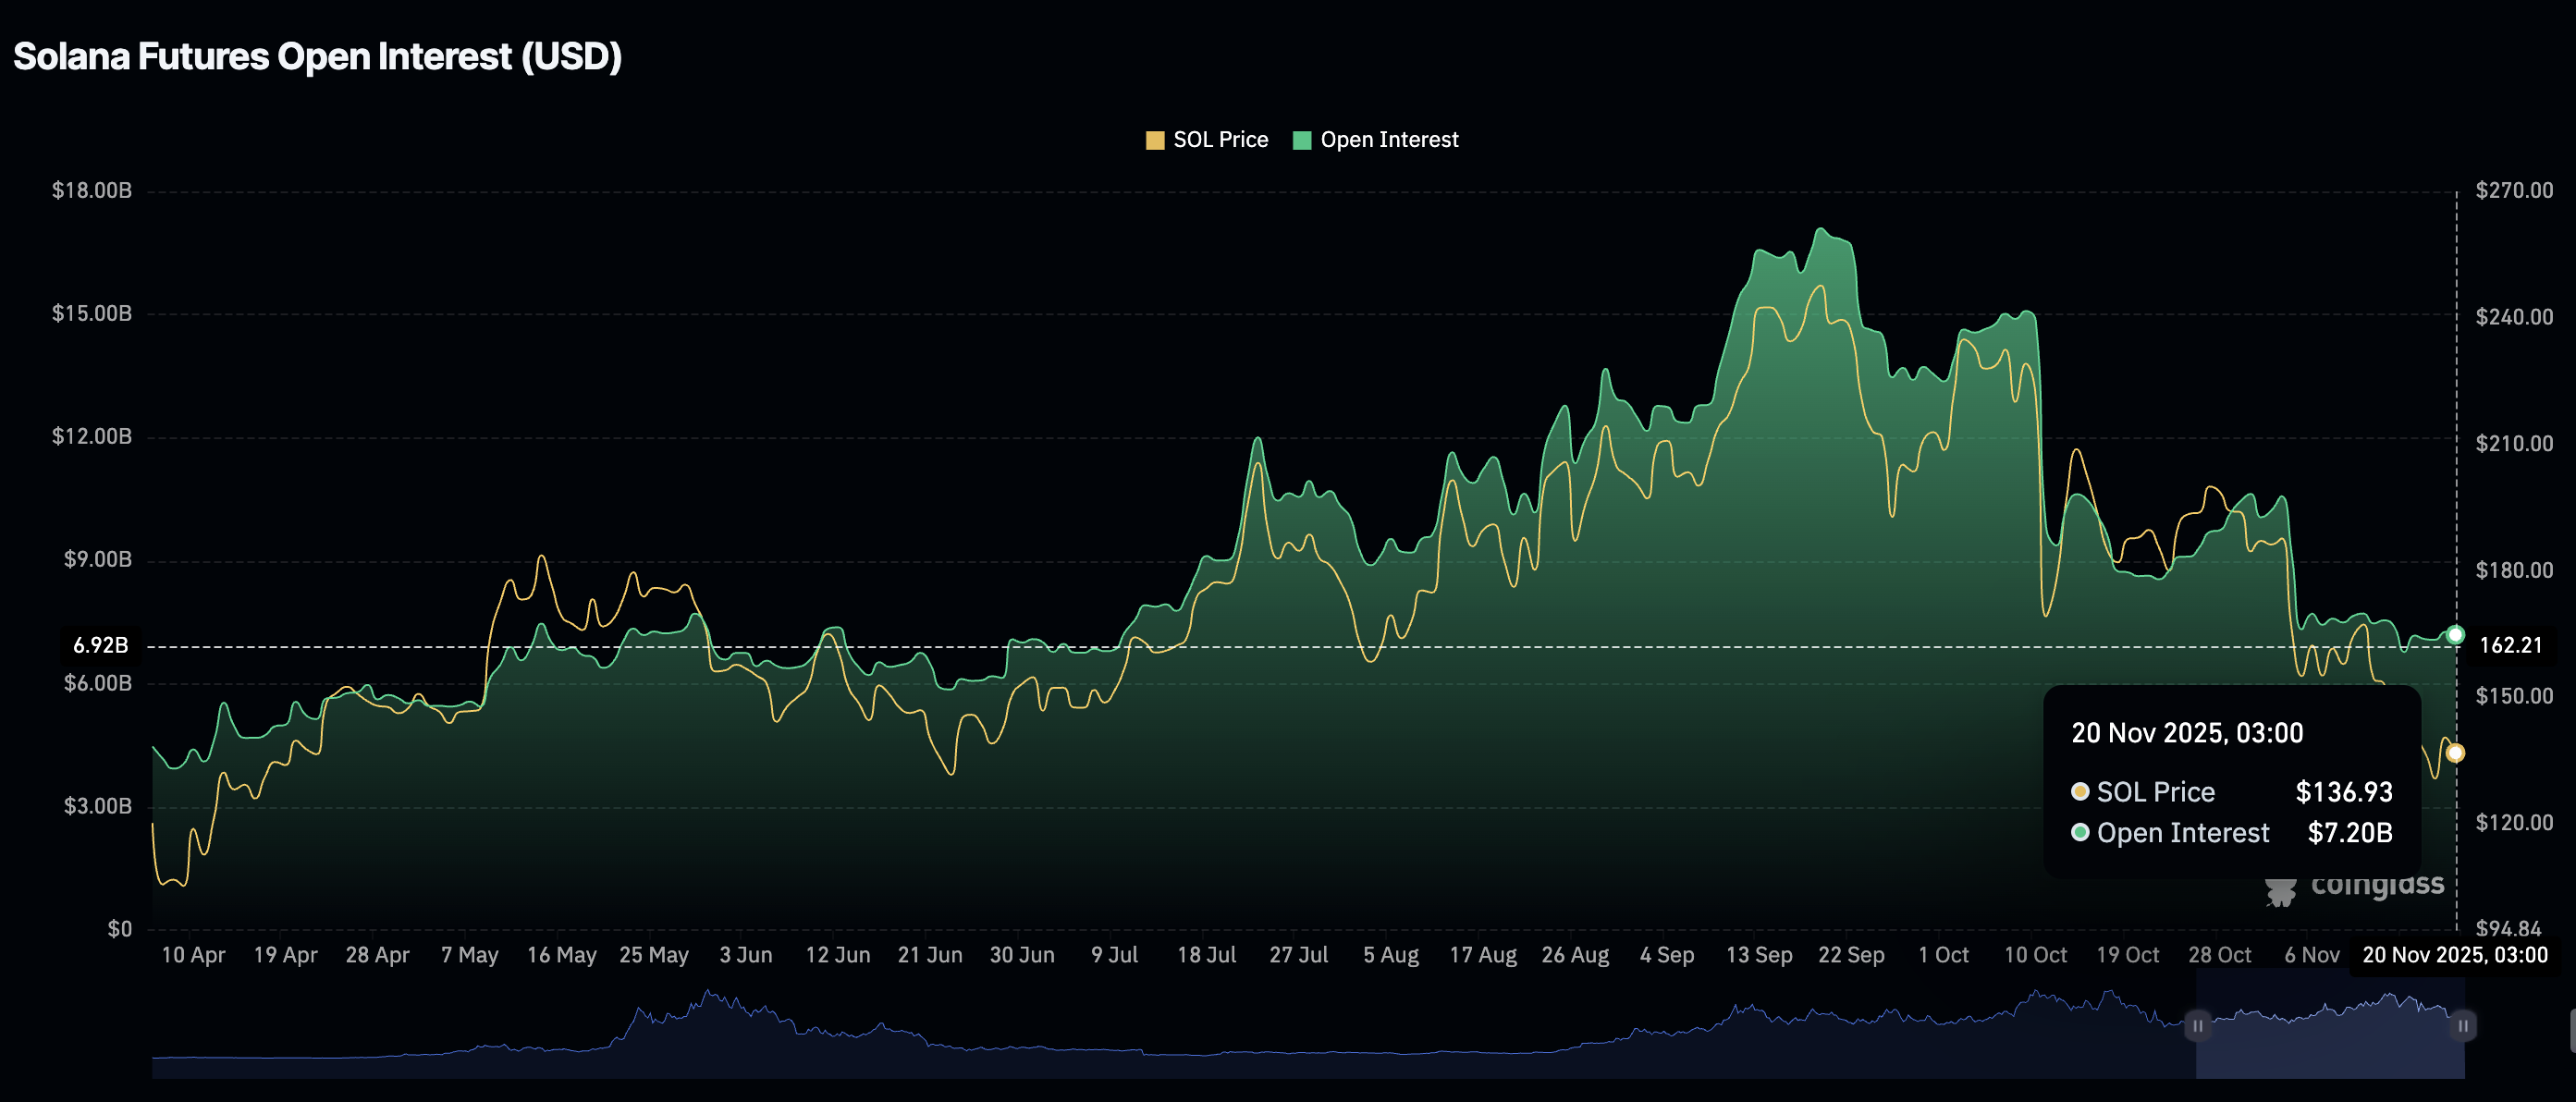
CoinGlass data shows Solana's futures Open Interest (OI) averaging $7.2 billion, down from $10 billion on November 1. The OI sits significantly below its $17 billion record peak achieved on September 19.
Since OI reflects the notional value of outstanding futures contracts, a steady increase is needed to support a near-term rebound. However, if risk-off sentiment persists and OI continues to decline in the coming days, the likelihood of Solana falling below $130 will increase.
Technical outlook: Solana bulls eye steady recovery
Solana hovers above $141 on the daily chart at the time of writing on Thursday. The token also sits well below falling moving averages, with the 50-day Exponential Moving Average (EMA) at $173 and the 200-day EMA at $180 capping rebounds. The Moving Average Convergence Divergence (MACD) indicator remains in negative territory and has been improving toward the zero line, suggesting fading bearish pressure.
The Relative Strength Index (RSI) at 38 reflects subdued momentum beneath the 50 midline. However, a steady rebound into the bullish region would indicate that bullish is increasing and bolster the uptrend above the 50- and 200-day EMAs.
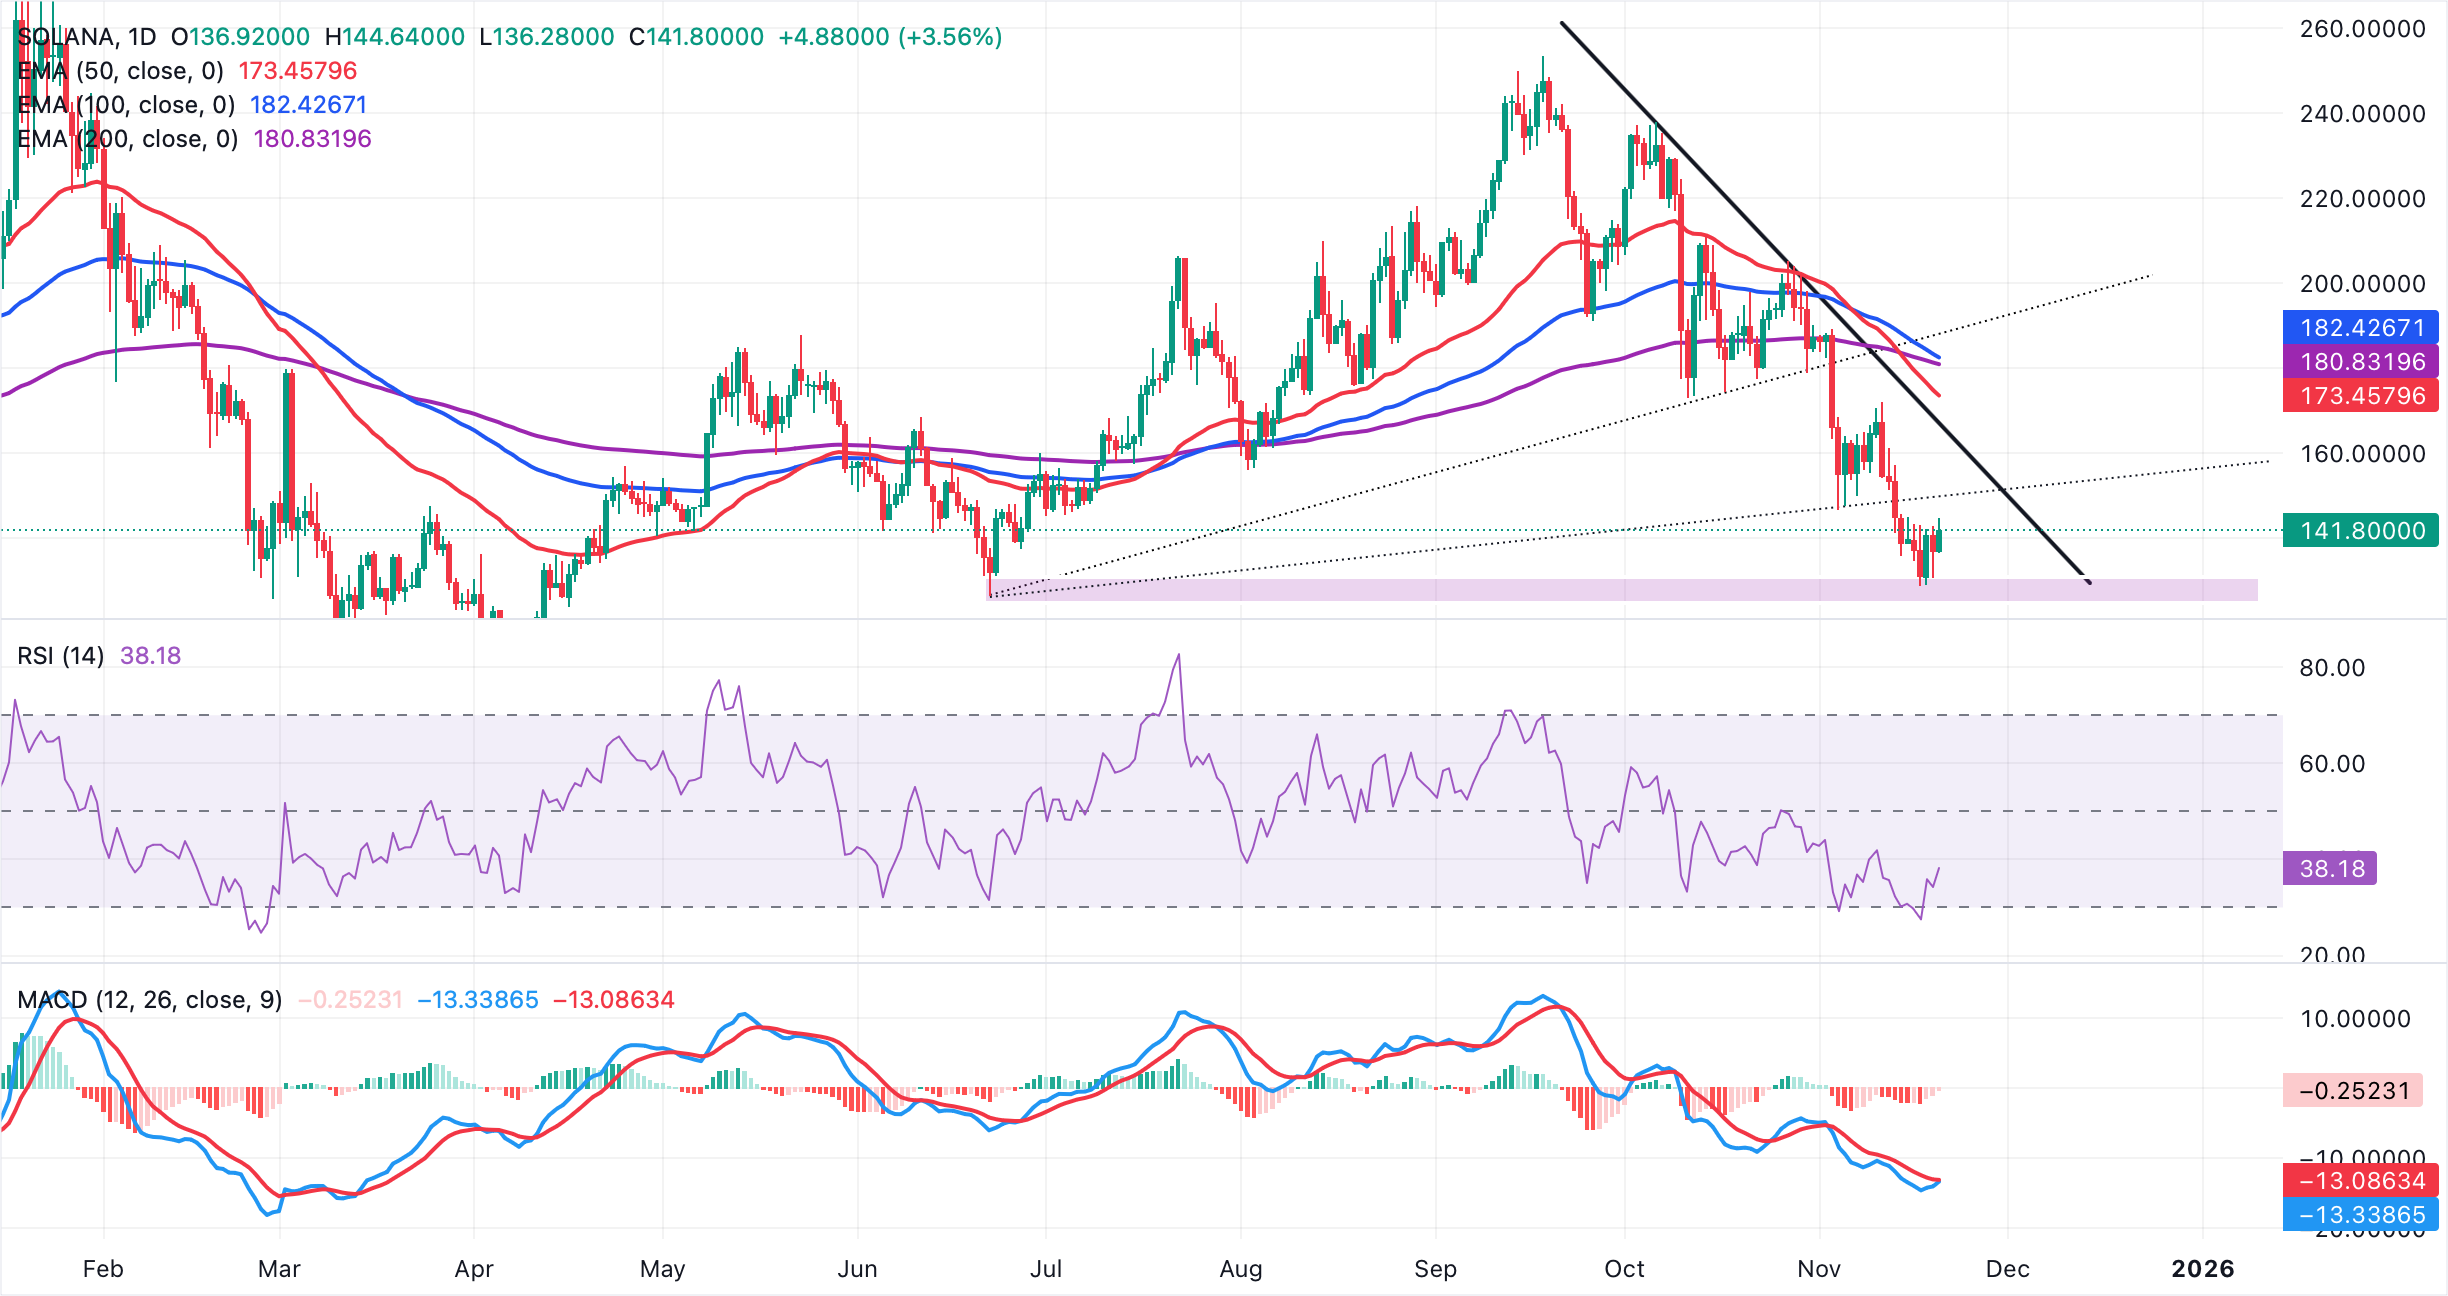
Still, the descending trend line from $261 limits the upside, with resistance seen near $166. Furthermore, the prior rising support from $125 was broken around $149, reinforcing the bearish tone.
A break above $160 round-number resistance could open a recovery above the 100-day EMA at $182, whereas failure to reclaim the broken support would keep sellers in control and maintain pressure under the moving average cluster.
Crypto ETF FAQs
An Exchange-Traded Fund (ETF) is an investment vehicle or an index that tracks the price of an underlying asset. ETFs can not only track a single asset, but a group of assets and sectors. For example, a Bitcoin ETF tracks Bitcoin’s price. ETF is a tool used by investors to gain exposure to a certain asset.
Yes. The first Bitcoin futures ETF in the US was approved by the US Securities & Exchange Commission in October 2021. A total of seven Bitcoin futures ETFs have been approved, with more than 20 still waiting for the regulator’s permission. The SEC says that the cryptocurrency industry is new and subject to manipulation, which is why it has been delaying crypto-related futures ETFs for the last few years.
Yes. The SEC approved in January 2024 the listing and trading of several Bitcoin spot Exchange-Traded Funds, opening the door to institutional capital and mainstream investors to trade the main crypto currency. The decision was hailed by the industry as a game changer.
The main advantage of crypto ETFs is the possibility of gaining exposure to a cryptocurrency without ownership, reducing the risk and cost of holding the asset. Other pros are a lower learning curve and higher security for investors since ETFs take charge of securing the underlying asset holdings. As for the main drawbacks, the main one is that as an investor you can’t have direct ownership of the asset, or, as they say in crypto, “not your keys, not your coins.” Other disadvantages are higher costs associated with holding crypto since ETFs charge fees for active management. Finally, even though investing in ETFs reduces the risk of holding an asset, price swings in the underlying cryptocurrency are likely to be reflected in the investment vehicle too.
(The technical analysis of this story was written with the help of an AI tool)
บทความแนะนำ


