


Sui Price Forecast: SUI rebounds amid record-high TVL, suiUSDe announcement
- SUI price advances in an upcycle within a symmetrical triangle pattern on the daily chart.
- Sui Network’s TVL reaches a record high of over $2.8 billion, as DEX volume shows a steady increase.
- Sui announced suiUSDe, a native stablecoin powered by Ethena.
Sui (SUI) price advances above $3.50 at the time of writing on Thursday, fueled by the announcement of the suiUSDe stablecoin. Meanwhile, the Total Value Locked (TVL) is at record-high levels, and rising Open Interest supports the bullish technical outlook.
SuiUSDe launch aligns with Sui network growth
Sui and Nasdaq-listed SUI Group Holdings Limited have announced the launch of a native stablecoin, suiUSDe, powered by Ethena. SuiUSDe will be backed by multiple digital assets and corresponding short futures positions. This adds to the list of USDi, a stablecoin by BlackRock USD Institutional Digital Liquidity Fund (BUIDL) tokenized money market fund to be launched on Sui.
DeFiLlama data indicate that the stablecoin market capitalization on Sui has increased by 18.61% in the last 24 hours, reaching $682.39 million, with USDC Dominance, backed by Circle, accounting for 66.97%.
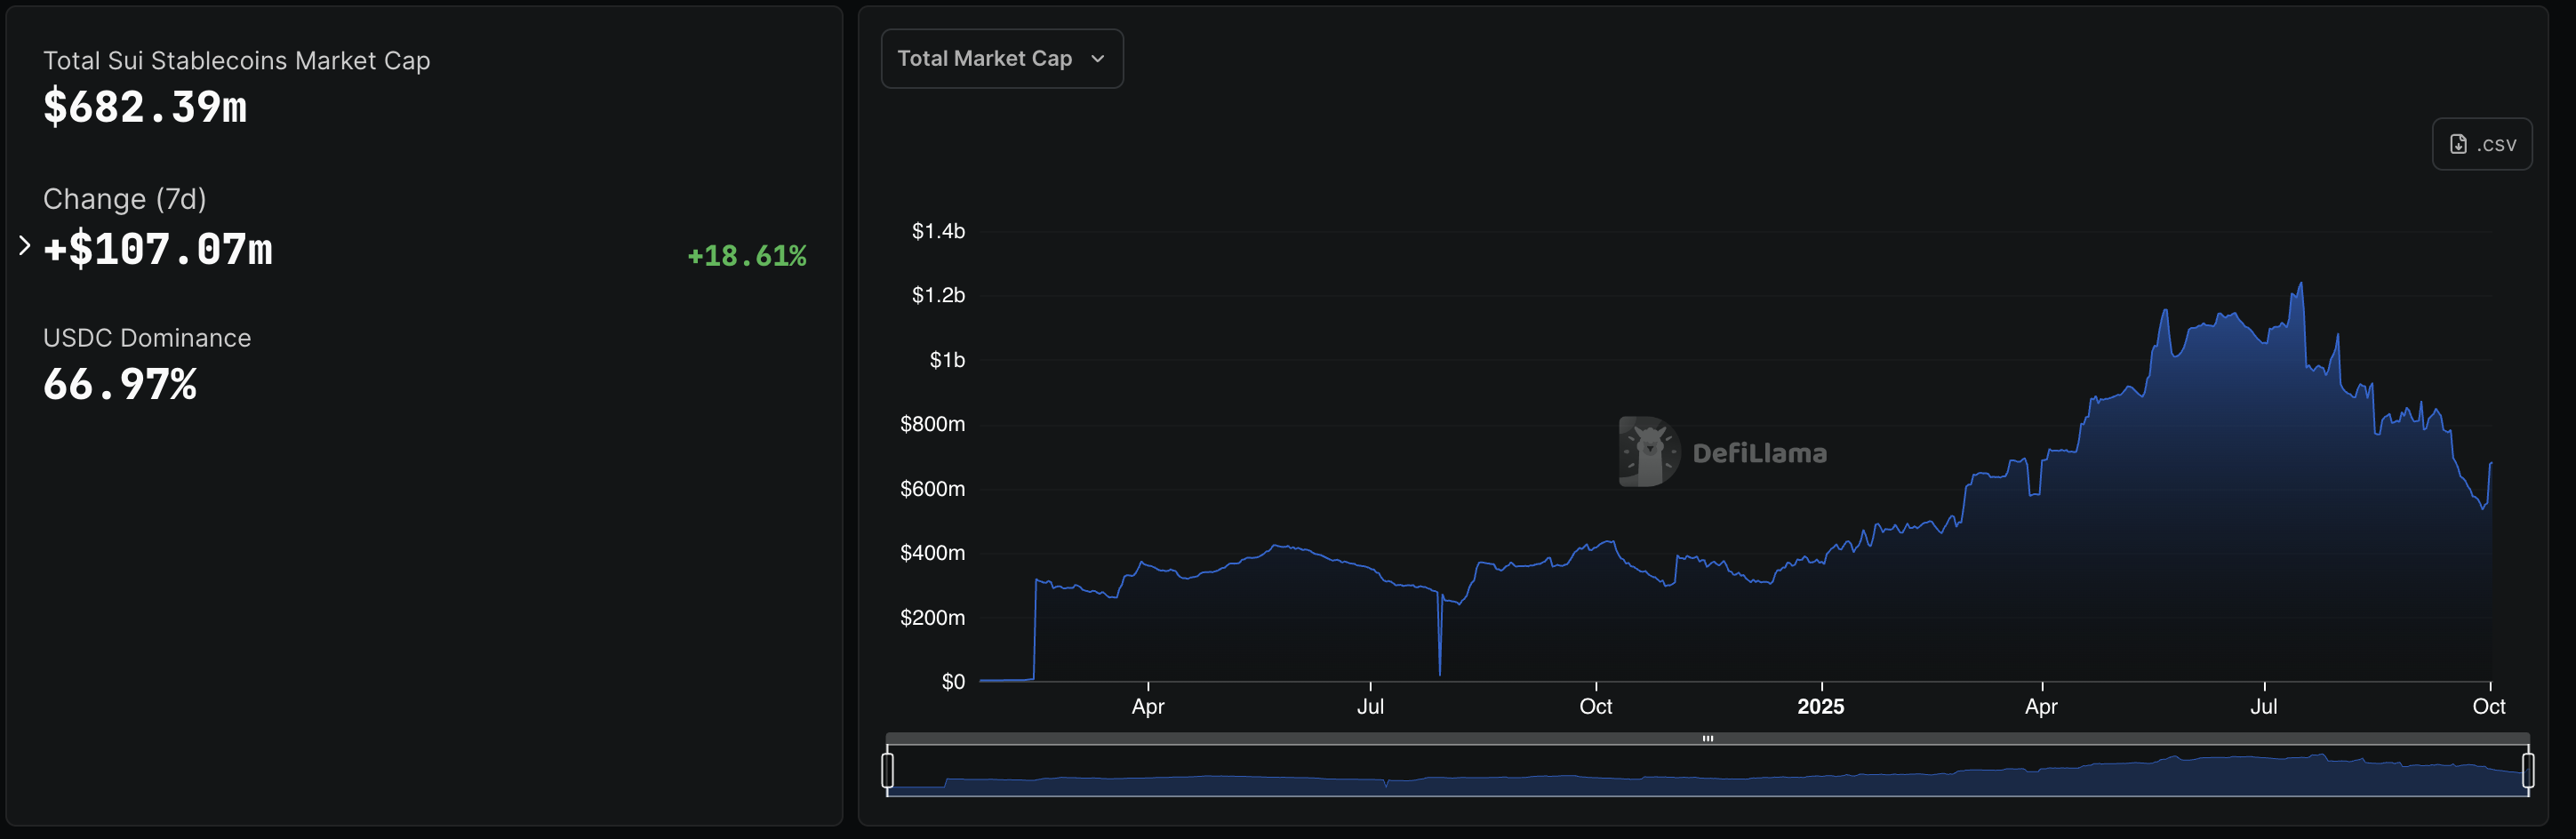
Sui Stablecoin market. Source: DeFiLlama
Apart from the rise of stablecoins, the Decentralized Exchange (DEX) trading volume on the network has remained steady above $500 million for the past three days. Additionally, the TVL on Sui Network has reached a record high of $2.388 billion, indicating elevated liquidity and user adoption.
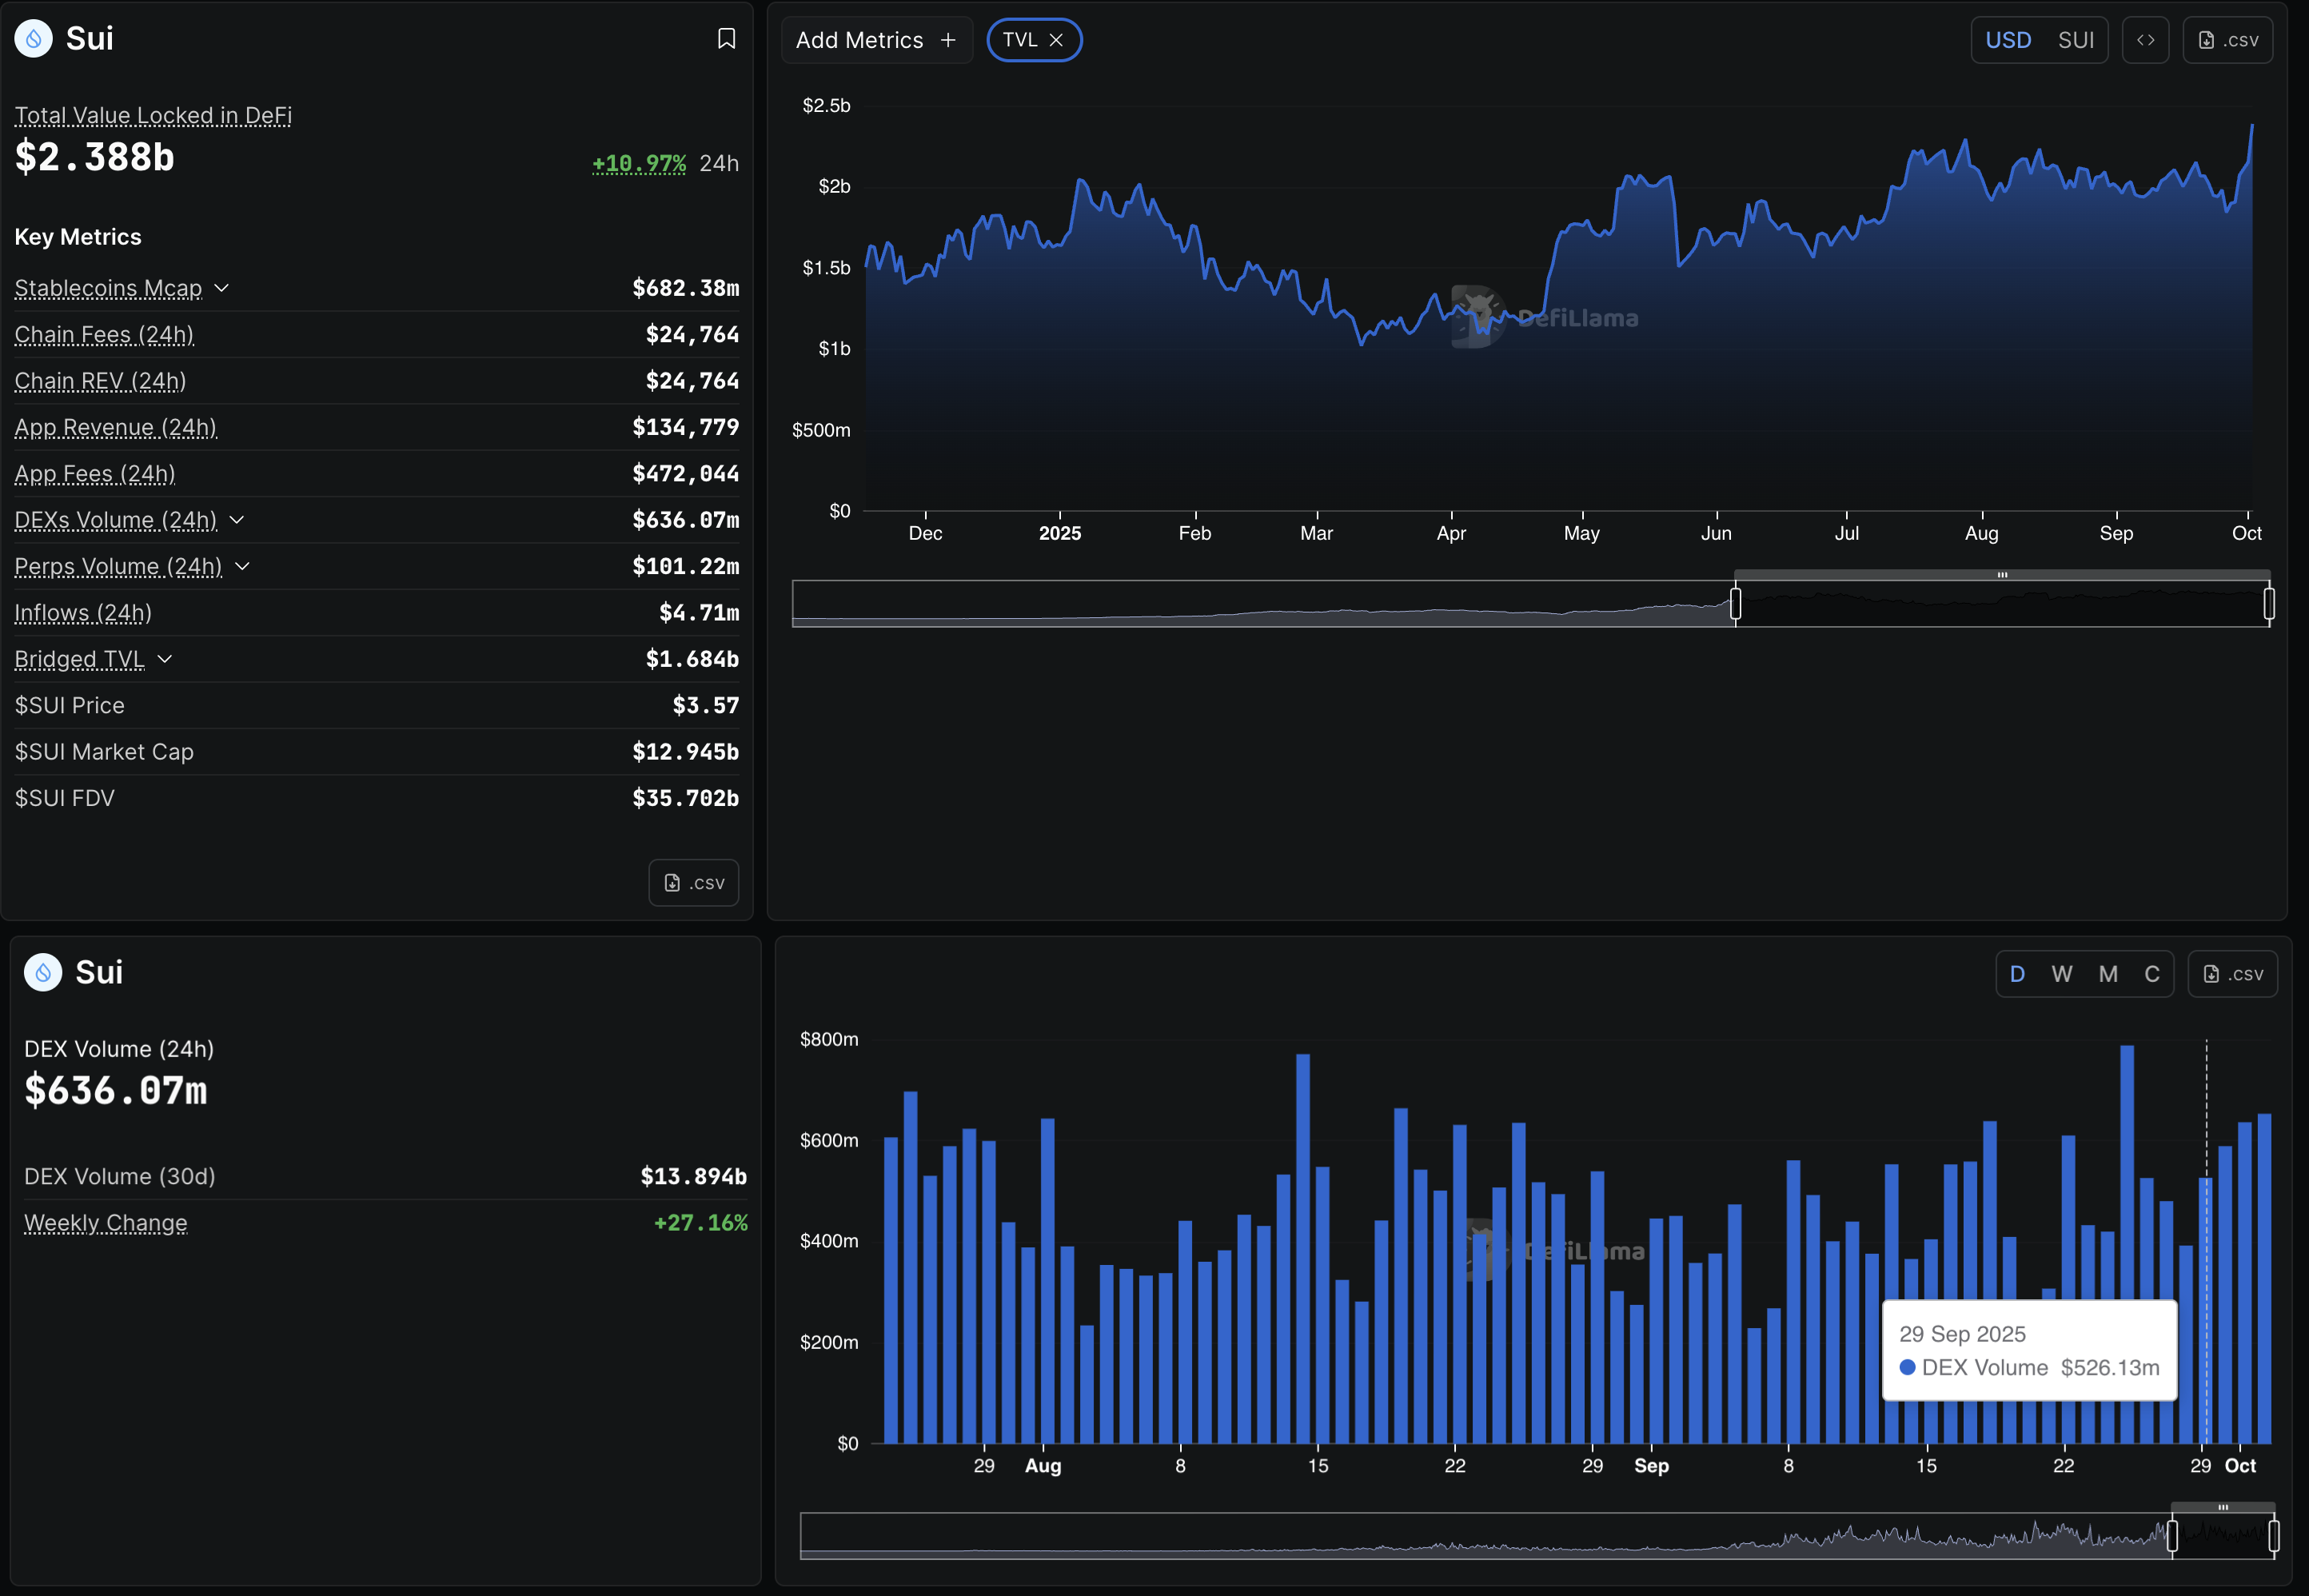
Sui TVL and DEX volume. Source: DeFiLlama
Sui rebounds within a symmetrical triangle
Sui edges higher by 1% at press time on Thursday, advancing the 8% surge from the previous day. The recovery run marks an upcycle within a symmetrical triangle pattern on the daily chart.
SUI trades above the 50% Fibonacci retracement level at $3.5430, retraced from the $5.3687 high of January 6 to the $1.7174 low of April 7. A decisive close above this level could stretch the recovery run to the 61.8% Fibonacci retracement level at $3.9739 near the triangle’s resistance trendline.
CoinGlass data indicates that the Open Interest (OI) of SUI has increased to $1.83 billion, up from $1.68 billion on Wednesday. This suggests risk-on sentiment among SUI derivatives traders.
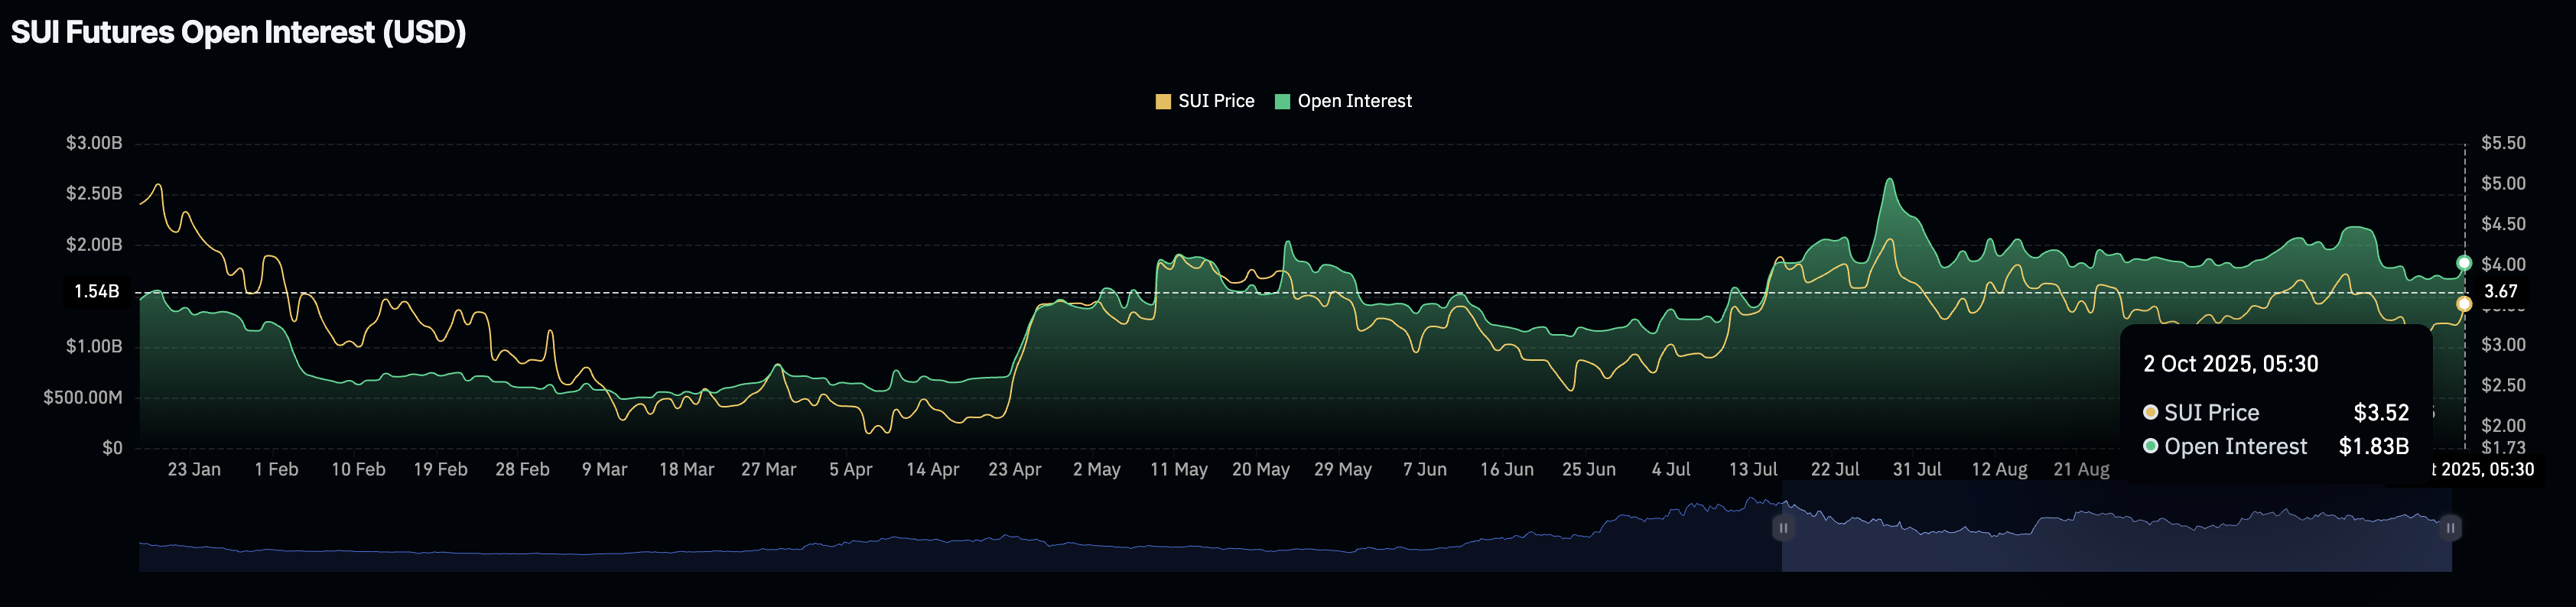
SUI Open Interest. Source: CoinGlass
The technical indicators on the daily chart corroborate the rise in buying pressure, as the Relative Strength Index (RSI) at 54 displays a steady uptrend above the midpoint. Additionally, the Moving Average Convergence Divergence (MACD) signals a bullish shift in momentum, as the crossover of the average lines indicates a new uptrend.
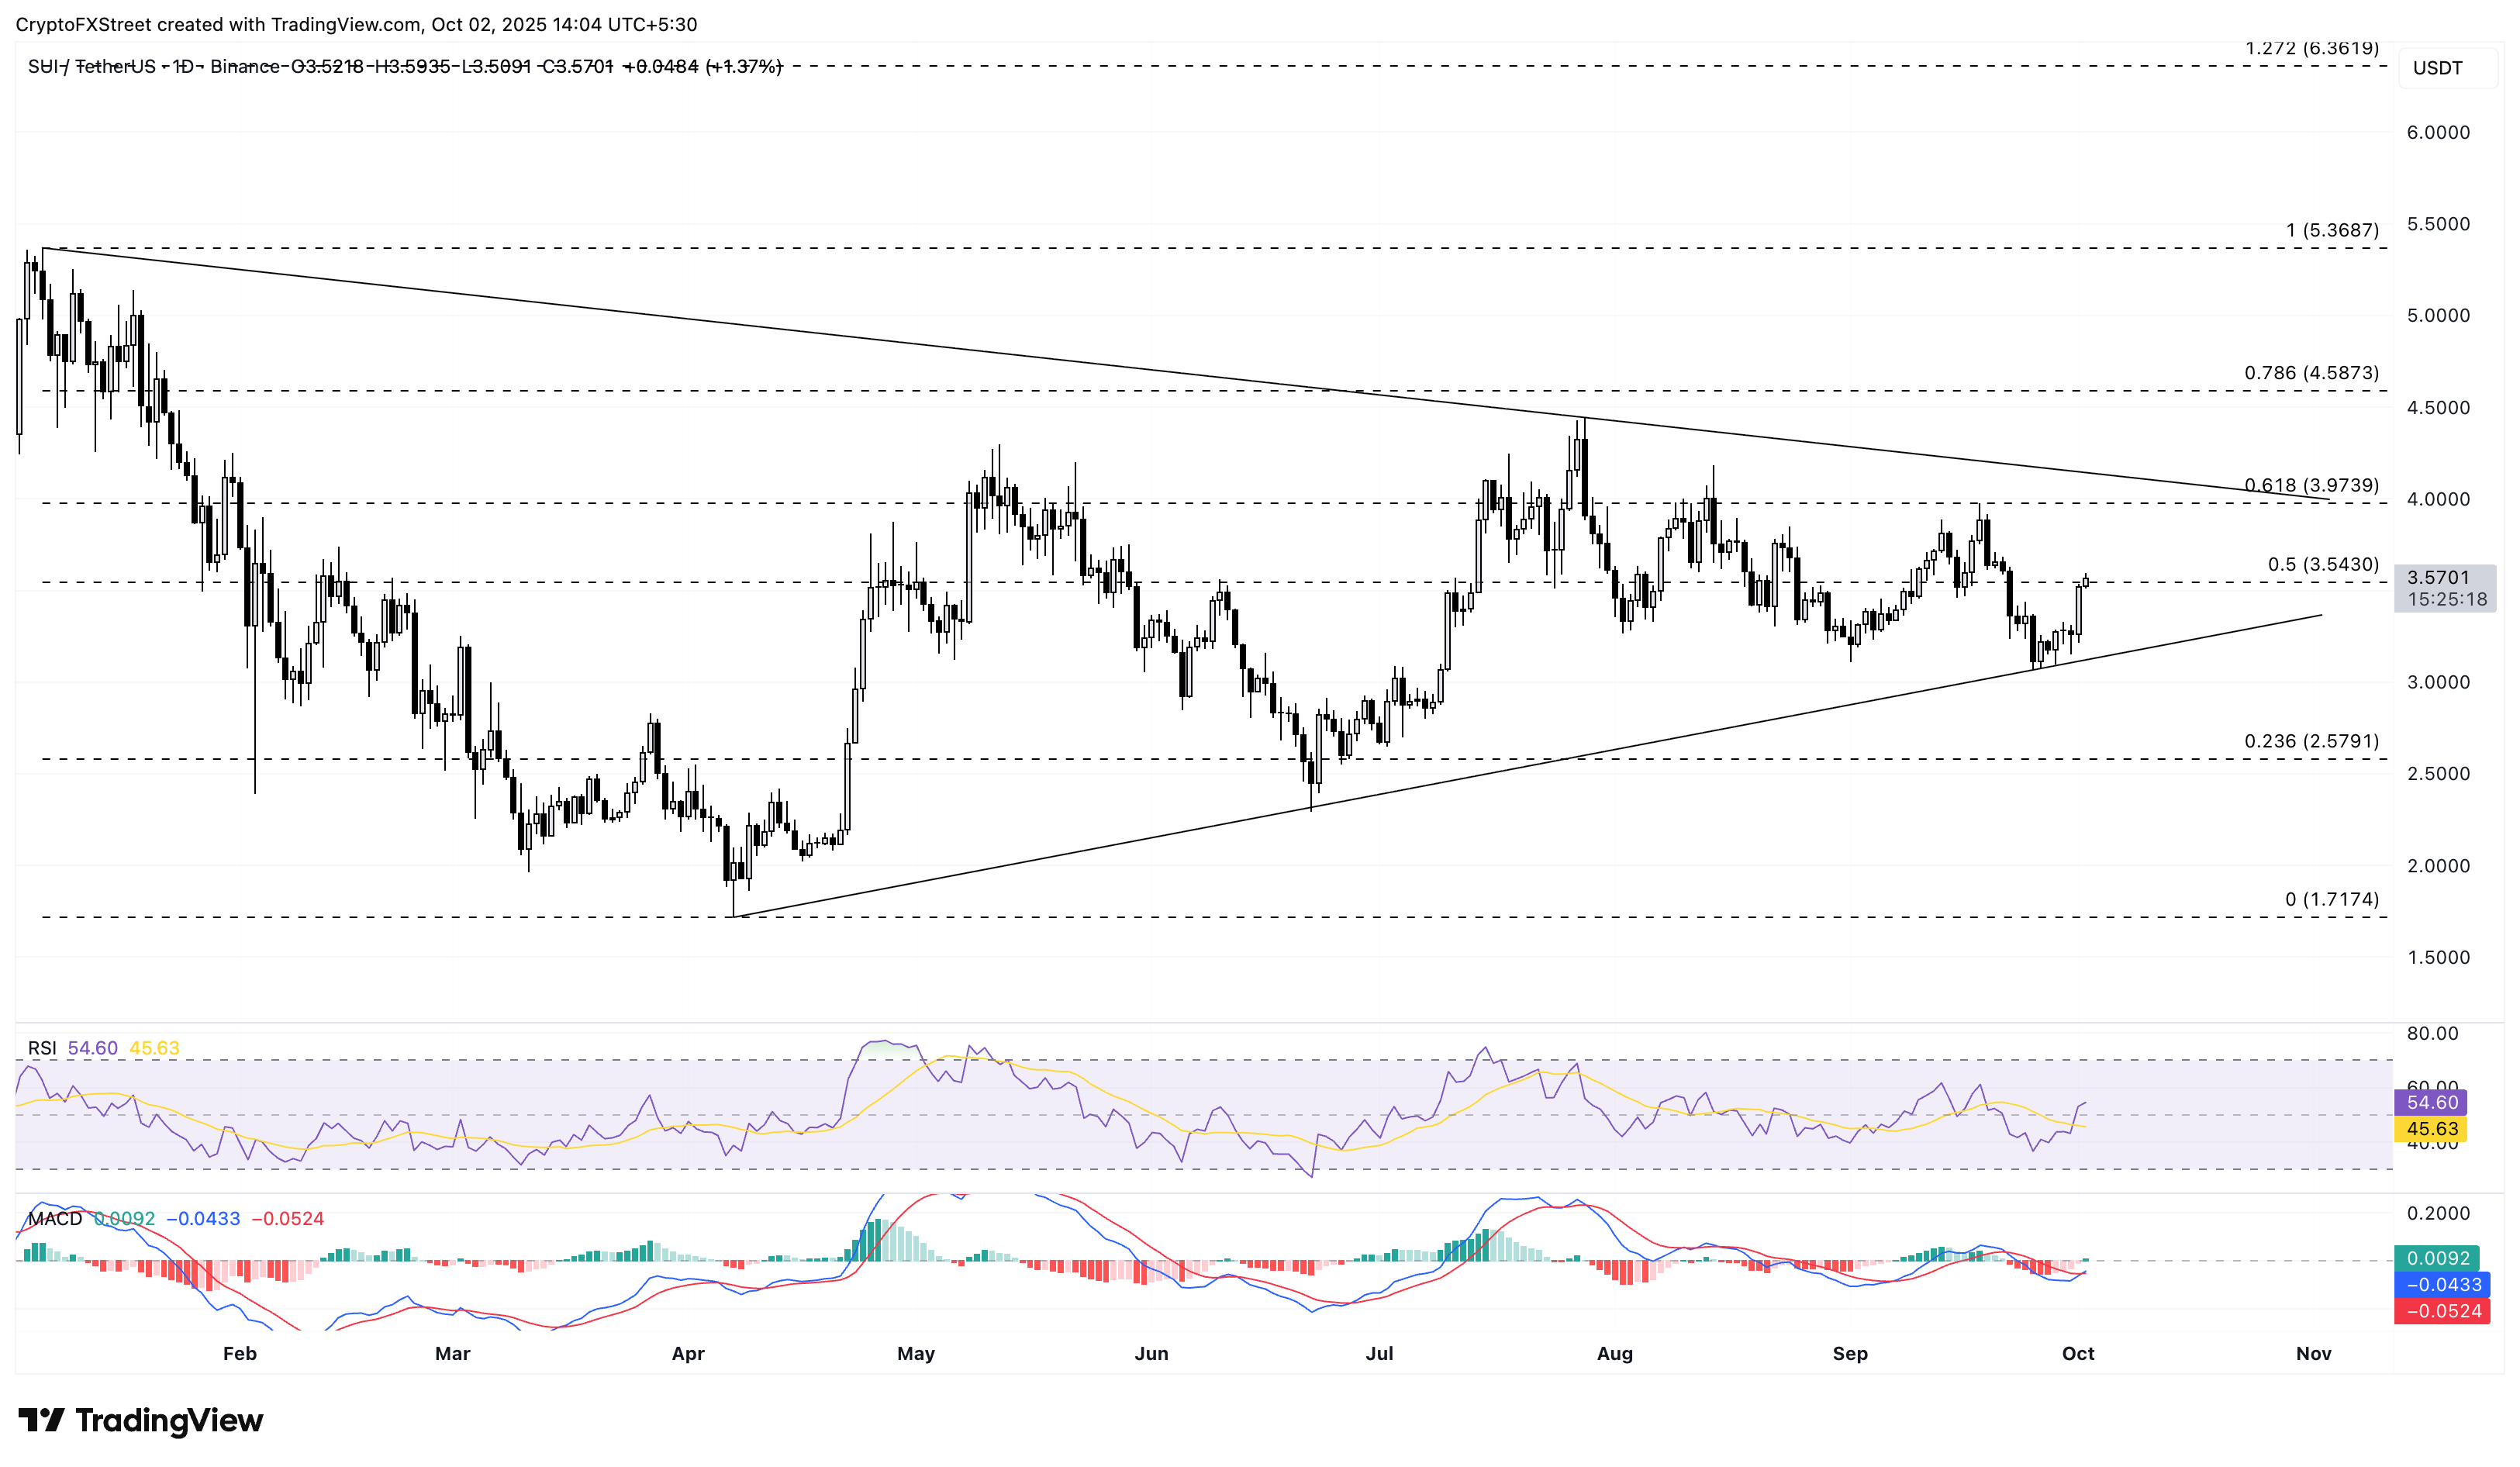
SUI/USDT daily price chart.
On the flip side, a reversal from $3.5430 could retest the support trendline at $3.1500.
บทความแนะนำ


