

Gold surges on mixed US data, increased Fed rate cut speculation
- Gold gains 1% on Friday, set to end the week with 0.20% gains.
- US PPI data was slightly above expectations, suggesting inflation is down but stalling above target, while UoM Consumer Sentiment highlights concerns over rising living costs.
- Despite higher US Treasury yields, with the 10-year note rising to 4.081%, Bullion prices remain supported as the Fed is expected to cut rates later this year.
Gold rallied over 1% on Friday, with the yellow metal set to end the week with modest gains of 0.20% after inflation data revealed on Friday and the Consumer Price Index (CPI) report on Thursday capped the Greenback’s advance. At the time of writing, XAU/USD trades at $2,658.
Mixed economic data underpinned the prices of the yellow metal. The US Bureau of Labor Statistics (BLS) revealed that prices paid by producers came near the consensus, indicating that inflation is trending down but above expectations. At the same time, the University of Michigan (UoM) Consumer Sentiment data for October showed a deterioration among Americans due to higher living costs.
Although the data didn’t affect the US Dollar, which remained firm, Bullion prices edged higher. This is even though US Treasury bond yields, particularly the 10-year T-note, gain one and a half basis points to 4.081%.
Chicago Fed President Austan Goolsbee crossed the wires on Bloomberg, praising the progress on inflation and the labor market. He added that despite the goodish September jobs report, there are no signs of overheating.
“The PPI numbers leaned friendly for the precious metals market bulls and suggest the Fed remains on track for two quarter-point interest rate cuts this year,” noted Jim Wyckoff, analyst at Kitco.
Next week, the US economic schedule remains busy, with Fed officials and the New York Fed Empire State Manufacturing Index continuing to grab the headlines. For the second part of the week, Retail Sales, Initial Jobless Claims, and housing data could dictate the Fed’s monetary policy path.
Daily digest market movers: Gold price climbs despite high US yields, strong USD
- Gold price finally broke the $2,650 barrier, yet it needs to achieve a daily close above that level to begin trading in the $2,650-$2,685 range.
- Consequently, the buck posts gains as seen by the US Dollar Index (DXY) gaining 0.02% to 102.90.
- The September US Producer Price Index (PPI) rose by 1.8% YoY, higher than the expected 1.6% but lower than August’s 1.9%. Core PPI increased by 2.8% YoY, exceeding forecasts and up from September's estimate of 2.7% and August's 2.6%.
- Monthly, PPI remained flat at 0%, lower than the estimated 0.1% and beneath August’s 0.2%. As expected, core PPI fell to 0.2%, down from the previous month's 0.3%.
- The University of Michigan (UoM) Consumer Sentiment Index deteriorated from 70.1 to 68.9, falling short of expectations of 70.8. Inflation expectations for one year were revised upward from 2.7% to 2.9%.
- The combination of a slightly higher Consumer Price Index (CPI) and a weak US employment report on Friday could lead to additional rate cuts by the Federal Reserve.
- Data from the Chicago Board of Trade, based on the December fed funds rate futures contract, indicates that investors estimate 49 basis points (bps) of easing by the Fed toward the end of 2024.
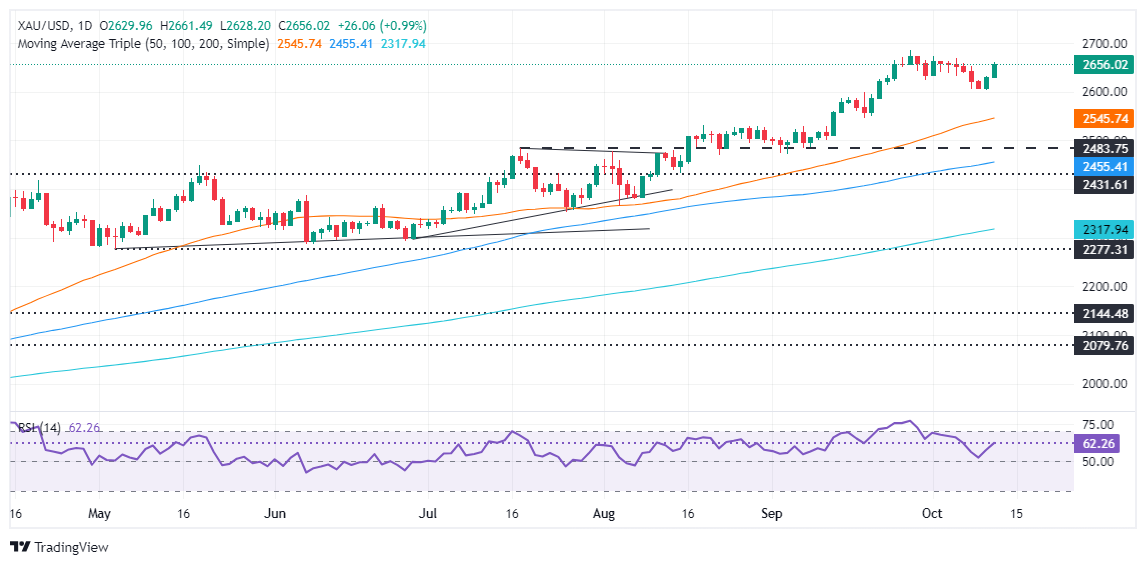
XAU/USD technical analysis: Gold price uptrend resumes, yet remains below $2,650
Gold’s uptrend has resumed, as the yellow metal posted back-to-back bullish daily candles, hinting that buyers could challenge the YTD high in the near term. According to the Relative Strength Index (RSI), momentum favors buyers, posting higher readings in bullish territory.
With that said, the XAU/USD first resistance would be the October 4 high at $2,670. Once surpassed, the next stop would be the YTD high of $2,685, ahead of the $2,700 mark.
Conversely, if XAU/USD falls underneath $2,650, this could sponsor a leg-down toward the $2,600 figure. A breach of the latter will expose the 50-day Simple Moving Average (SMA) at $2,545.
Gold FAQs
Gold has played a key role in human’s history as it has been widely used as a store of value and medium of exchange. Currently, apart from its shine and usage for jewelry, the precious metal is widely seen as a safe-haven asset, meaning that it is considered a good investment during turbulent times. Gold is also widely seen as a hedge against inflation and against depreciating currencies as it doesn’t rely on any specific issuer or government.
Central banks are the biggest Gold holders. In their aim to support their currencies in turbulent times, central banks tend to diversify their reserves and buy Gold to improve the perceived strength of the economy and the currency. High Gold reserves can be a source of trust for a country’s solvency. Central banks added 1,136 tonnes of Gold worth around $70 billion to their reserves in 2022, according to data from the World Gold Council. This is the highest yearly purchase since records began. Central banks from emerging economies such as China, India and Turkey are quickly increasing their Gold reserves.
Gold has an inverse correlation with the US Dollar and US Treasuries, which are both major reserve and safe-haven assets. When the Dollar depreciates, Gold tends to rise, enabling investors and central banks to diversify their assets in turbulent times. Gold is also inversely correlated with risk assets. A rally in the stock market tends to weaken Gold price, while sell-offs in riskier markets tend to favor the precious metal.
The price can move due to a wide range of factors. Geopolitical instability or fears of a deep recession can quickly make Gold price escalate due to its safe-haven status. As a yield-less asset, Gold tends to rise with lower interest rates, while higher cost of money usually weighs down on the yellow metal. Still, most moves depend on how the US Dollar (USD) behaves as the asset is priced in dollars (XAU/USD). A strong Dollar tends to keep the price of Gold controlled, whereas a weaker Dollar is likely to push Gold prices up.
추천 기사


