US equities get dragged higher by upbeat tech sector, NASDAQ 100 hits record high

Mitrade
coverImg
Source: DepositPhotos

US equities broadly rally as markets shrug off mid-week rate tantrum.


Indexes climbed on tech-led earnings expectations.


S&P 500, NASDAQ both close near all-time highs.


US equity indexes saw broad gains on Thursday after US stock traders shook off the early week's misery over Federal Reserve (Fed) rate cuts unlikely to come as soon as money markets are hoping. Despite the early week's gains, equity indexes closed near all-time highs on Thursday after the tech sector led major indexes into the top end on earnings hope and general AI hype.


Large-cap tech stocks led the larger market higher on a rosy AI-fueled revenue outlook, with chipmakers seeing the largest gains, particularly tech companies that provide the necessary hardware for AI projects.


According to the CME’s FedWatch tool, markets are now pricing in just a 57% chance of a rate cut from the Fed by the Federal Open Market Committee’s (FOMC) March meeting, with money markets currently pricing in 100% odds of at least some form of Fed easing by May 1. This stands in sharp contrast to the Fed’s current stance, with multiple FOMC governors hitting newswires this week talking down odds of any moves on rates until inflation continues down to 2% appreciably, with notable Fed members including Atlanta Fed President Raphael Bostic noting on Thursday that he doesn’t see Fed reference rates coming down until August at the earliest, barring any significant changes in the US’ current economic outlook.


The S&P 500 (S&P) closed within touch distance of all-time highs of $4,812.38, ending Thursday at $4,780.94 to gain 41.73 points on the day, climbing 0.88%. The Dow Jones Industrial Average (DJIA) climbed over half a percent to gain 201.94 points on Thursday, closing at $37,468.61 while the NASDAQ Composite equity index soared 1.35% to climb over 200 points, ending the day at $15,055.65.


NASDAQ 100 Technical Outlook


The NASDAQ 100 mega-cap stock index soared to a record high on Thursday, climbing to an all-time high of $16,994.56 and wrapping up Thursday’s market action at $16,982.29, gaining 246.01 points or 1.47%.


Technical levels remain well below current price action, with the 50-day and 200-day Simple Moving Averages (SMA) at $16,254.00 and $15,038.00 respectively. The index has climbed nearly 21% from October’s decline into $14,057.00, and the NASDAQ 100 is on pace to close in the green for all but one of the last 12 consecutive trading weeks.
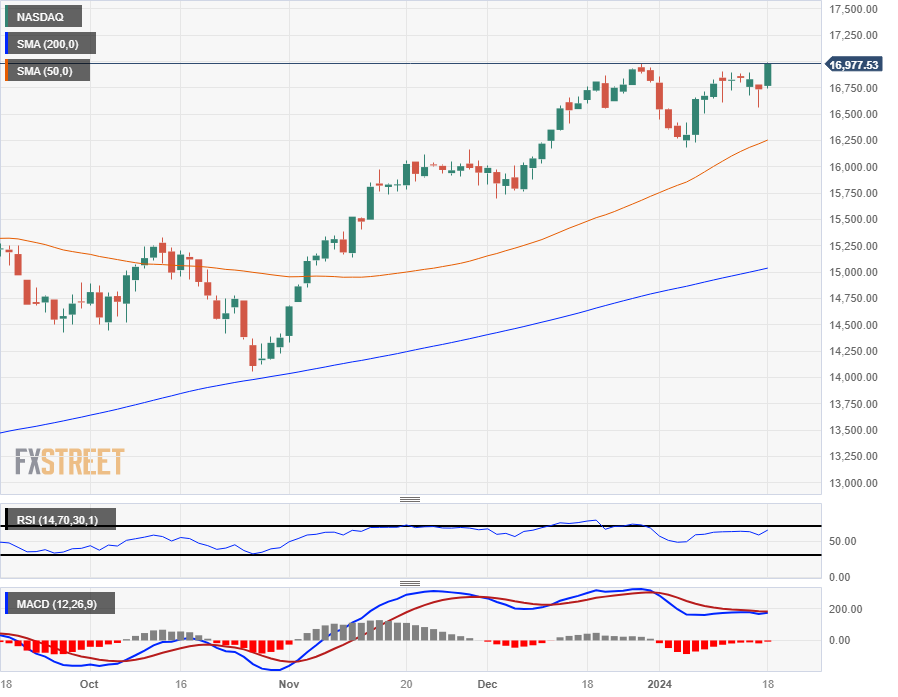

NASDAQ 100 Daily Chart, Source: TradingView.


Read more

  • Gold Price Forecast: Gold Plunges to Seven-Week Low, Can $4,100 Hold?
  • RBA set to hike interest rate to 4.60% in September as inflation remains elevated
  • * The content presented above, whether from a third party or not, is considered as general advice only.  This article should not be construed as containing investment advice, investment recommendations, an offer of or solicitation for any transactions in financial instruments.

    goTop
    quote
    Related Articles
    placeholder
    【Daily Brief】30-year Treasury tops 5.59%, S&P 500 slips to 7,670 and gold holds $4,180 — PCE lands tonightThe 30-year Treasury yield closed at 5.59%, its highest since June 2002, and the Dow fell 131.59 points to 51,349.92. US consumer confidence dropped to 81.9, a 12-year low, and JOLTS job openings fell to 7.1 million. August PCE and Q3 GDP both land at 8:30am ET tonight.
    Author  Suzie
    10 hours ago
    The 30-year Treasury yield closed at 5.59%, its highest since June 2002, and the Dow fell 131.59 points to 51,349.92. US consumer confidence dropped to 81.9, a 12-year low, and JOLTS job openings fell to 7.1 million. August PCE and Q3 GDP both land at 8:30am ET tonight.
    placeholder
    【Daily Brief】10-year Treasury yield briefly tops 5%, S&P 500 slips to 7,602 and the dollar firms at 99.3 as the Fed's decision eve beginsThe 10-year Treasury yield touched 5.014% on Monday — its first print above 5% since October 2023 — while the S&P 500 closed 0.48% lower at 7,619.98 and the dollar index firmed to 99.3. Here is the full market wrap ahead of Wednesday's FOMC decision, the dot plot and the August retail sales report, plus today's CLARITY Act Senate vote.
    Author  Irene Q.
    Sep 15, Tue
    The 10-year Treasury yield touched 5.014% on Monday — its first print above 5% since October 2023 — while the S&P 500 closed 0.48% lower at 7,619.98 and the dollar index firmed to 99.3. Here is the full market wrap ahead of Wednesday's FOMC decision, the dot plot and the August retail sales report, plus today's CLARITY Act Senate vote.
    placeholder
    Fed hike odds near 90% into Wednesday's decision — how to trade the dollar, gold and the S&P 500A 0.3% monthly core CPI print has lifted the market-implied probability of a 25bp Fed hike on 16 September to roughly 86.5% ~ 90%, which would be the first increase since July 2023. Here is the decision timeline, the pricing versus the forecasts, both scenarios, and the key levels for the dollar, gold and the S&P 500.
    Author  Suzie
    Sep 14, Mon
    A 0.3% monthly core CPI print has lifted the market-implied probability of a 25bp Fed hike on 16 September to roughly 86.5% ~ 90%, which would be the first increase since July 2023. Here is the decision timeline, the pricing versus the forecasts, both scenarios, and the key levels for the dollar, gold and the S&P 500.
    placeholder
    Hot August jobs report reignites Fed-hike bets; S&P 500 slips below 7,700 — what to watch before the September FOMCAugust nonfarm payrolls surged to 162,000, three times the consensus, pushing CME FedWatch odds of a September 25-bp hike to 58.4% and dragging the S&P 500 below 7,700. CPI, PPI and the Sept 15-16 FOMC decision now set the tone for US stocks.
    Author  Irene Q.
    Sep 07, Mon
    August nonfarm payrolls surged to 162,000, three times the consensus, pushing CME FedWatch odds of a September 25-bp hike to 58.4% and dragging the S&P 500 below 7,700. CPI, PPI and the Sept 15-16 FOMC decision now set the tone for US stocks.
    placeholder
    TradingKey Daily Market Brief: Gold Falls Below $4,000, TSMC’s Strong Earnings Fail to Stop AI Trade Cooling, Chip Stocks Sold OffTracking Market TrendsTradingKey - On July 16, Eastern Time, the three major US stock indexes closed down collectively. Although US economic data performed robustly and the start of the Q2 earnings se
    Author  TradingKey
    Jul 17, Fri
    Tracking Market TrendsTradingKey - On July 16, Eastern Time, the three major US stock indexes closed down collectively. Although US economic data performed robustly and the start of the Q2 earnings se
    Live Quotes
    Name / SymbolChart% Change / Price
    NAS100
    NAS100
    0.00%0.00
    US500
    US500
    0.00%0.00

    S&P 500 Related Articles

    • Wall Street’s Top 10 US Stocks for 2026 vs What Reddit Is Actually Buying
    • Top 10 Best Brokers for Indices Trading
    • S&P 500 to 7,500 in 2026? How Tech Stocks Could Drive 20% Gains (Or Not)
    • How To Trade Indices? Index Trading Beginner's Guide for 2023

    Click to view more