Bitcoin Price Forecast: BTC extends recovery as ETF records positive flows 

Mitrade
Trending Articles
coverImg
Source: DepositPhotos
  • Bitcoin price extends its recovery above $91,500 on Thursday, following a rebound from its key support level.

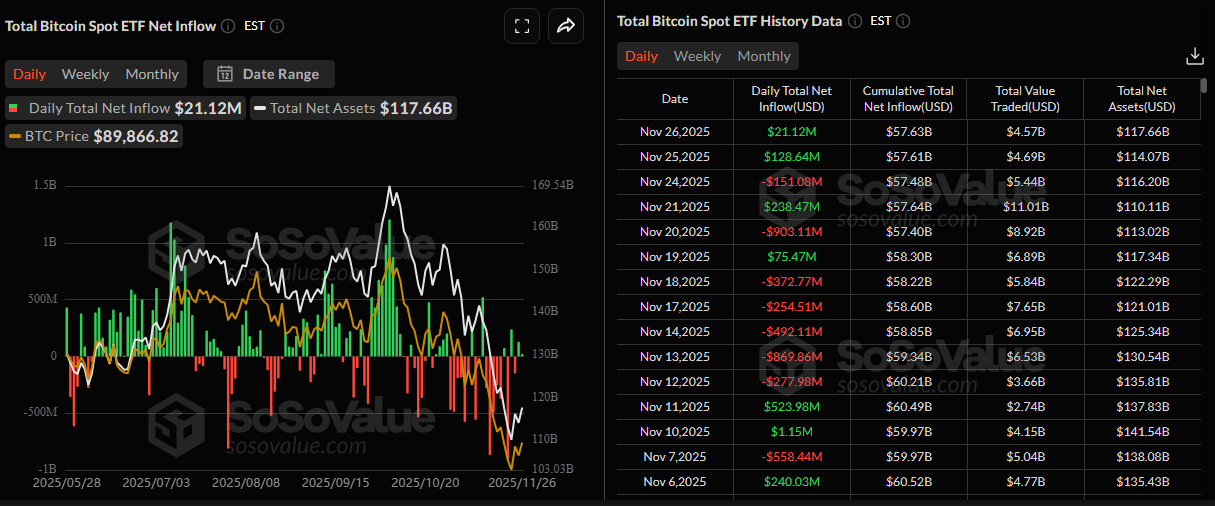
  • US-listed spot ETFs recorded a mild inflow of $21.12 million on Wednesday, the second day of positive flows this week.

  • On-chain data shows BTC’s market drifting lower amid limited inflows and fragile liquidity.

Bitcoin (BTC) price continues to trade in green above $91,500 at the time of writing on Thursday after rebounding from the key support level. On the institutional front, a modest inflow into US-listed spot Bitcoin Exchange Traded Funds (ETFs) signals a reduction in selling pressure and further support BTC’s recovery. However, traders should still be cautious as on-chain data highlights BTC’s market drifting lower amid limited inflows and fragile liquidity.

Bitcoin institutional demand records mild inflows

Institutional demand for Bitcoin shows a reduction in selling pressure. According to SoSoValue data, US-listed spot Bitcoin ETFs recorded a mild inflow of $21.12 million on Wednesday, after a positive flow of $128.64 million the previous day. However, these inflow intensities are not as strong as the outflow streak recorded last week. For BTC to continue its recovery, the inflow trend should persist and intensify.

On-chain data show BTC’s fragile market conditions

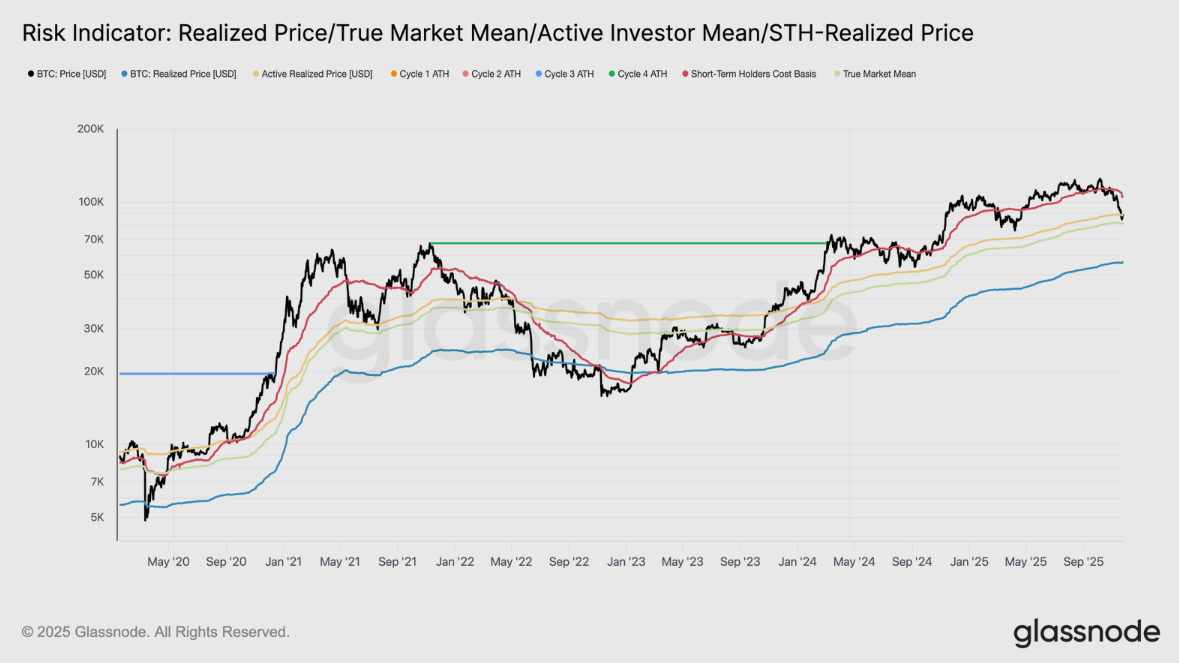
Glassnode's weekly report on Wednesday states that Bitcoin remains structurally fragile, trading within the $81,000 – $89,000 range after breaking below key cost-basis levels. A structure closely resembling the Q1 2022 post all-time high interval, where the market weakened under fading demand. This current range reflects the same dynamic, with the market drifting lower amid limited inflows and fragile liquidity.

The report further explained that with a weakening market structure, liquidity becomes the key lens for understanding what comes next. A prolonged low-liquidity regime increases the risk of further contraction, and the STH Realized Profit/Loss Ratio offers one of the clearest windows into current demand momentum. The ratio, which compares realized profits to realized losses among recent investors, slipped below its neutral Mean (4.3 times) in early October and has now collapsed to 0.07. 

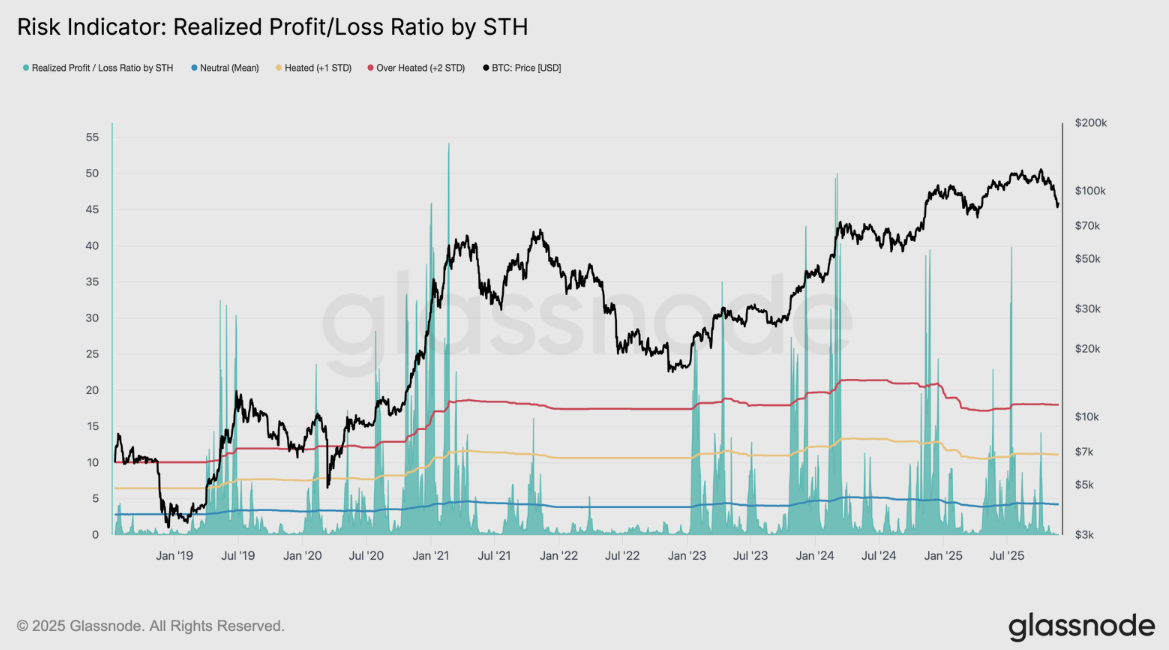
Such overwhelming loss dominance confirms that liquidity has evaporated, especially after the heavy demand absorption seen in (Q2 – Q3) 2025, as long-term holders increased their spending. If this ratio remains depressed, market conditions could begin to mirror the weakness of Q1 2022, raising the risk of a breakdown below the True Market Mean at $81,000.

‘Until price reclaims key cost-basis levels and new inflows return, the market is likely to stay in a low-conviction consolidation, ’ concluded the analyst.

Bitcoin Price Forecast: BTC closes above $90,000 mark

Bitcoin price found support roughly around the key psychological level of $80,000 last week and recovered slightly over the weekend. BTC continued its rebound at the start of this week, closing above $90,000 on Wednesday. At the time of writing on Thursday, BTC continues trading higher above $91,500.

If BTC continues its recovery, it could extend the rally toward the next key psychological level at $100,000.

The Relative Strength Index (RSI) on the daily chart is 41, pointing upward toward the neutral 50 level, indicating fading bearish momentum. Additionally, the Moving Average Convergence Divergence (MACD) showed a bullish crossover on Thursday, providing a buy signal and further supporting the potential continuation of the recovery.

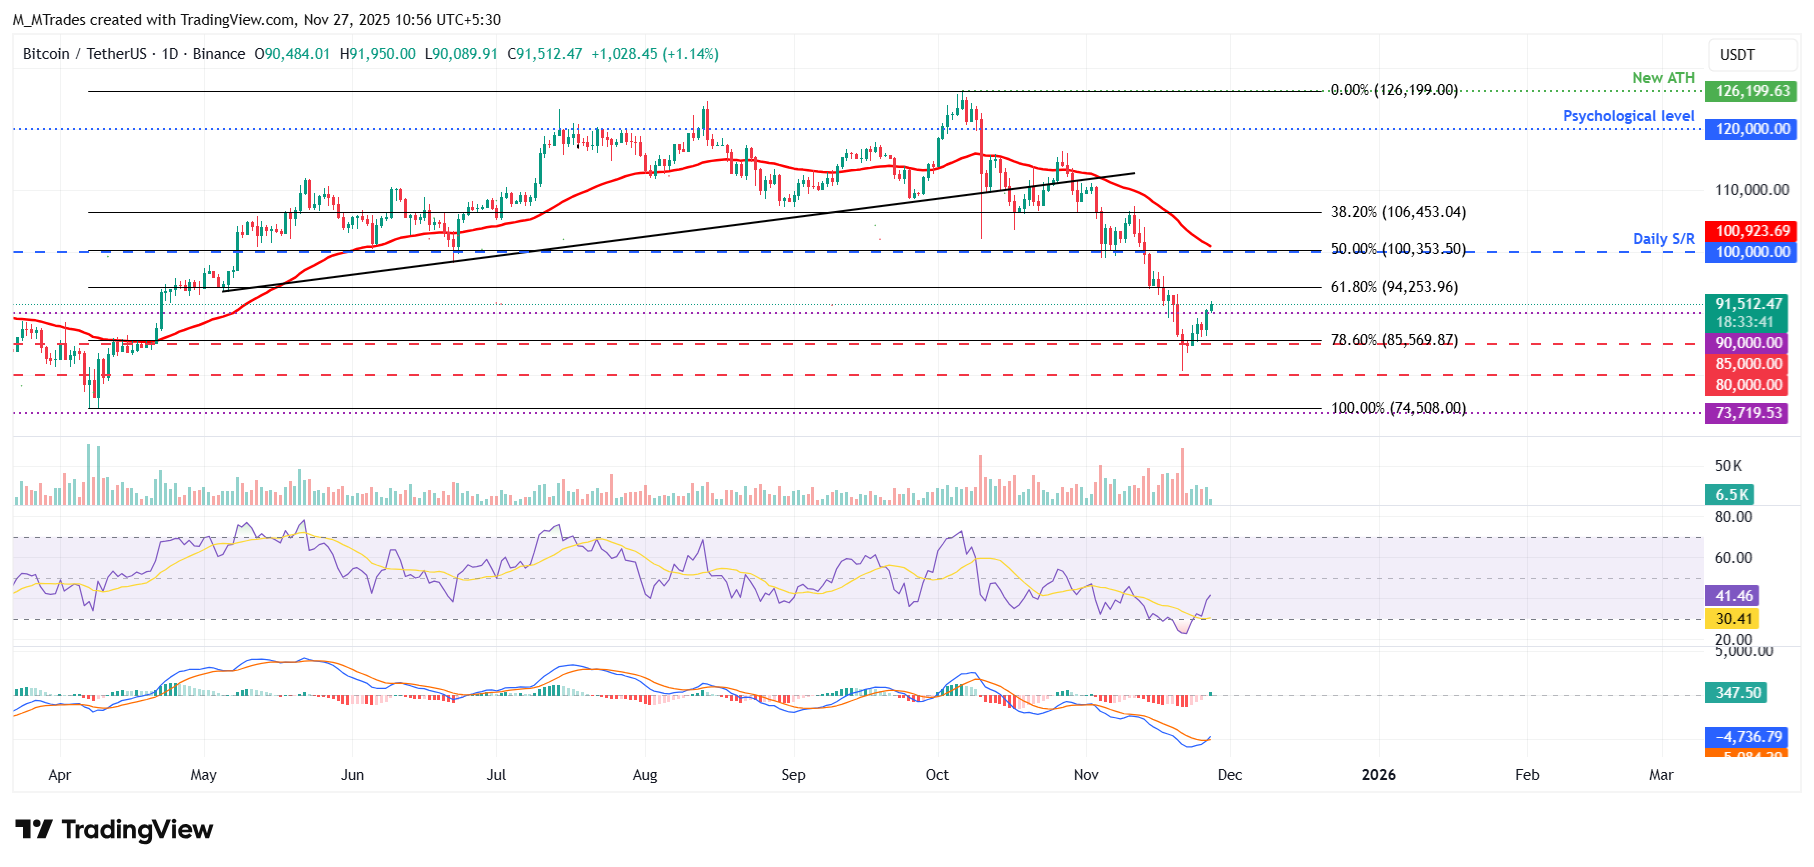
On the other hand, if BTC faces a correction, it could extend the decline toward the key support at $85,000.

Bitcoin, altcoins, stablecoins FAQs

Bitcoin is the largest cryptocurrency by market capitalization, a virtual currency designed to serve as money. This form of payment cannot be controlled by any one person, group, or entity, which eliminates the need for third-party participation during financial transactions.

Altcoins are any cryptocurrency apart from Bitcoin, but some also regard Ethereum as a non-altcoin because it is from these two cryptocurrencies that forking happens. If this is true, then Litecoin is the first altcoin, forked from the Bitcoin protocol and, therefore, an “improved” version of it.

Stablecoins are cryptocurrencies designed to have a stable price, with their value backed by a reserve of the asset it represents. To achieve this, the value of any one stablecoin is pegged to a commodity or financial instrument, such as the US Dollar (USD), with its supply regulated by an algorithm or demand. The main goal of stablecoins is to provide an on/off-ramp for investors willing to trade and invest in cryptocurrencies. Stablecoins also allow investors to store value since cryptocurrencies, in general, are subject to volatility.

Bitcoin dominance is the ratio of Bitcoin's market capitalization to the total market capitalization of all cryptocurrencies combined. It provides a clear picture of Bitcoin’s interest among investors. A high BTC dominance typically happens before and during a bull run, in which investors resort to investing in relatively stable and high market capitalization cryptocurrency like Bitcoin. A drop in BTC dominance usually means that investors are moving their capital and/or profits to altcoins in a quest for higher returns, which usually triggers an explosion of altcoin rallies.

Read more

  • U.S. November Nonfarm Payrolls: What Does the Rare "Weak Jobs, Strong Economy" Mix Mean for U.S. Equities?
  • AUD/USD remains depressed below mid-0.6600s; downside seems limited ahead of US NFP report
  • * The content presented above, whether from a third party or not, is considered as general advice only.  This article should not be construed as containing investment advice, investment recommendations, an offer of or solicitation for any transactions in financial instruments.

    goTop
    quote
    Related Articles
    placeholder
    Bitcoin-to-Gold Ratio Plummets 50% as Gold Breaks $4,000 in 2025In 2025, gold outpaced Bitcoin, slashing the BTC-to-gold ratio by half from 40 to 20 ounces per BTC.
    Author  Mitrade
    14 hours ago
    In 2025, gold outpaced Bitcoin, slashing the BTC-to-gold ratio by half from 40 to 20 ounces per BTC.
    placeholder
    Senate Delays Crypto Market Structure Hearings to Early 2026The Senate Banking Committee has postponed cryptocurrency market structure hearings until 2026, citing ongoing bipartisan negotiations.
    Author  Mitrade
    Yesterday 05: 56
    The Senate Banking Committee has postponed cryptocurrency market structure hearings until 2026, citing ongoing bipartisan negotiations.
    placeholder
    Bitcoin Slides 5% as Sellers Lean In — Can BTC Reclaim $88,000?Bitcoin has dropped back below $88,000 after rolling over from $90,500, with price still trading under the 100-hour Simple Moving Average. The sell-off found a floor at $85,151, and BTC is now consolidating near that base, but rebounds are facing pressure from a bearish trend line around $89,000. Bulls need to retake $88,000–$89,000 to ease downside risk; failure to do so keeps $85,500–$85,000 and then $83,500 in play, with $80,000 as the deeper “line in the sand.” Bitcoin (BTC) is back in damage-control mode after a sharp pullback wiped out recent gains. The price failed to reclaim the $90,000–$90,500 band, rolled over, and slid through $88,500 before briefly dipping under $87,000. Buyers did show up around $85,000, but the rebound so far looks more like stabilization than a clear trend reversal. Bitcoin dips hard, finds a bid near $85,000(h3) BTC’s latest move lower began when it couldn’t build follow-through above $90,000 and $90,500. Once that upside stalled, sellers took control and pushed price down through $88,500. The slide accelerated enough to spike below $87,000, but the market didn’t free-fall. Bulls defended the $85,000 zone, printing a low at $85,151. Since then, Bitcoin has been consolidating below the 23.6% Fibonacci retracement of the drop from the $93,560 swing high to the $85,151 low — a clue that the bounce is still shallow and that sellers haven’t fully backed off yet. Structurally, BTC is still on the back foot: It’s trading below $88,000, and It remains below the 100-hour Simple Moving Average, keeping short-term trend pressure pointed downward. Resistance is layered, and $89,000 is the problem area(h3) If bulls try to turn this into a recovery, they’ll have to climb through multiple ceilings in quick succession. First, BTC faces resistance around $87,150, followed by a more meaningful barrier near $87,500. From there, the market’s attention snaps back to $88,000 — the level BTC just lost and now needs to reclaim. A close back above $88,000 would improve the tone, but it doesn’t solve the bigger issue: there’s a bearish trend line on the hourly BTC/USD chart (Kraken feed) with resistance near $89,000, which also lines up with the next technical hurdle. If BTC can push through $89,000 and hold, the rebound could extend toward $90,000, with follow-through targets at $91,000 and $91,500. But until price clears that $88,000–$89,000 zone, rallies are at risk of being sold rather than chased. If BTC fails to reclaim resistance, the downside path is clear(h3) The near-term bear case is simple: if Bitcoin can’t climb back above the $87,000 area and keep traction, sellers may attempt another leg lower. Support levels line up like this: Immediate support: $85,500 First major support: $85,000 Next support: $83,500 Then $82,500 in the near term Below that, the major “don’t break this” level is still $80,000. If BTC slips under $80,000, the risk of acceleration to the downside increases significantly — not because it’s magic, but because it’s the kind of psychological and structural level that tends to trigger forced de-risking. Indicators: momentum still leans bearish(h3) The intraday indicators aren’t offering much comfort yet: Hourly MACD is losing pace in the bearish zone. Hourly RSI remains below 50, suggesting sellers still have the upper hand on short timeframes. So while the $85,000 defense held for now, the market hasn’t flipped bullish — it’s just stopped bleeding.
    Author  Mitrade
    Yesterday 02: 56
    Bitcoin has dropped back below $88,000 after rolling over from $90,500, with price still trading under the 100-hour Simple Moving Average. The sell-off found a floor at $85,151, and BTC is now consolidating near that base, but rebounds are facing pressure from a bearish trend line around $89,000. Bulls need to retake $88,000–$89,000 to ease downside risk; failure to do so keeps $85,500–$85,000 and then $83,500 in play, with $80,000 as the deeper “line in the sand.” Bitcoin (BTC) is back in damage-control mode after a sharp pullback wiped out recent gains. The price failed to reclaim the $90,000–$90,500 band, rolled over, and slid through $88,500 before briefly dipping under $87,000. Buyers did show up around $85,000, but the rebound so far looks more like stabilization than a clear trend reversal. Bitcoin dips hard, finds a bid near $85,000(h3) BTC’s latest move lower began when it couldn’t build follow-through above $90,000 and $90,500. Once that upside stalled, sellers took control and pushed price down through $88,500. The slide accelerated enough to spike below $87,000, but the market didn’t free-fall. Bulls defended the $85,000 zone, printing a low at $85,151. Since then, Bitcoin has been consolidating below the 23.6% Fibonacci retracement of the drop from the $93,560 swing high to the $85,151 low — a clue that the bounce is still shallow and that sellers haven’t fully backed off yet. Structurally, BTC is still on the back foot: It’s trading below $88,000, and It remains below the 100-hour Simple Moving Average, keeping short-term trend pressure pointed downward. Resistance is layered, and $89,000 is the problem area(h3) If bulls try to turn this into a recovery, they’ll have to climb through multiple ceilings in quick succession. First, BTC faces resistance around $87,150, followed by a more meaningful barrier near $87,500. From there, the market’s attention snaps back to $88,000 — the level BTC just lost and now needs to reclaim. A close back above $88,000 would improve the tone, but it doesn’t solve the bigger issue: there’s a bearish trend line on the hourly BTC/USD chart (Kraken feed) with resistance near $89,000, which also lines up with the next technical hurdle. If BTC can push through $89,000 and hold, the rebound could extend toward $90,000, with follow-through targets at $91,000 and $91,500. But until price clears that $88,000–$89,000 zone, rallies are at risk of being sold rather than chased. If BTC fails to reclaim resistance, the downside path is clear(h3) The near-term bear case is simple: if Bitcoin can’t climb back above the $87,000 area and keep traction, sellers may attempt another leg lower. Support levels line up like this: Immediate support: $85,500 First major support: $85,000 Next support: $83,500 Then $82,500 in the near term Below that, the major “don’t break this” level is still $80,000. If BTC slips under $80,000, the risk of acceleration to the downside increases significantly — not because it’s magic, but because it’s the kind of psychological and structural level that tends to trigger forced de-risking. Indicators: momentum still leans bearish(h3) The intraday indicators aren’t offering much comfort yet: Hourly MACD is losing pace in the bearish zone. Hourly RSI remains below 50, suggesting sellers still have the upper hand on short timeframes. So while the $85,000 defense held for now, the market hasn’t flipped bullish — it’s just stopped bleeding.
    placeholder
    Macro Analysts: Hawkish Japan Could Push Bitcoin Below $70KAnalysts predict Bitcoin may face further declines towards the $70,000 mark if the Bank of Japan raises interest rates as expected.
    Author  Mitrade
    Dec 15, Mon
    Analysts predict Bitcoin may face further declines towards the $70,000 mark if the Bank of Japan raises interest rates as expected.
    placeholder
    Fed Cuts Rates: Bitcoin Rallies Then Retreats - Bear Market Ahead?TradingKey - Fed Rate Cut Fails to Buoy Bitcoin, Signaling Bull Market's End?Early on December 11,the Federal Reserve delivered an expected 25 basis point rate cut.Bitcoin (BTC) briefly surged to $94,
    Author  TradingKey
    Dec 11, Thu
    TradingKey - Fed Rate Cut Fails to Buoy Bitcoin, Signaling Bull Market's End?Early on December 11,the Federal Reserve delivered an expected 25 basis point rate cut.Bitcoin (BTC) briefly surged to $94,

    Bitcoin Related Articles

    • Trading Chart Patterns:Ultimate Guide to Price Action
    • How to Day Trade Crypto? Simplest Day Trading Strategy Ever
    • Places that Provide Cheapest Ways to Buy Bitcoin In 2025
    • 10 Best Crypto With Most Potential to Buy and invest in 2025 - Top Picks from Expert Traders
    • Top 10 Bitcoin Mining Apps for Android & iOS During 2024
    • How To Buy Bitcoin In Malaysia? Top 7 Best Crypto Exchanges & Trading Apps

    Click to view more