


The Stock Market Is Flashing a Warning Sign for Only the 6th Time in 156 Years, and History Is Clear What Direction Stocks Could Go Next
Key Points
The CAPE ratio is a valuation metric that helps determine whether the stock market is over- or undervalued.
History shows that when the CAPE ratio lingers above 30, the market usually winds up experiencing a correction.
The CAPE ratio currently sits at 41, its second-highest level in history.
- Motley Fool Issues Rare "Total Conviction" Buy Alert ›
The S&P 500 (SNPINDEX:^GSPC), Nasdaq Composite (NASDAQINDEX:^IXIC), and Dow Jones Industrial Average (DJINDICES:^DJI) have each enjoyed abnormally high gains in recent years, fueled in large part by euphoria around artificial intelligence (AI) stocks. Investors are pouring historic levels of capital into companies designing AI chips, cloud infrastructure providers, and enterprise software. This has pushed stock market valuations into historically elevated levels.
One revealing valuation indicator is the cyclically adjusted price-to-earnings (CAPE) ratio, commonly called the Shiller P/E ratio. Developed by Nobel Prize-winning economist Robert Shiller, this tool compares the S&P 500's current price with its average inflation-adjusted earnings over the last 10 years.
Missed AI’s "Act 1"? Act 2 Could Be 15x Bigger. Most investors think they missed the AI boat because they didn't buy Nvidia in 2005. But according to our analysts, we’re only at the end of "Act 1"—the R&D phase. "Act 2" is the global rollout. Continue »
Unlike a conventional price-to-earnings (P/E) ratio, the CAPE ratio smooths out volatility in corporate earnings. This approach provides a longer-term perspective on stock market valuations.
Historically, the CAPE ratio has averaged 17.8. Today, it sits at 40.7, or 129% above its long-term average. Although elevated valuations do not automatically signal an imminent crash, history suggests investors should temper their expectations when stocks become pricey.
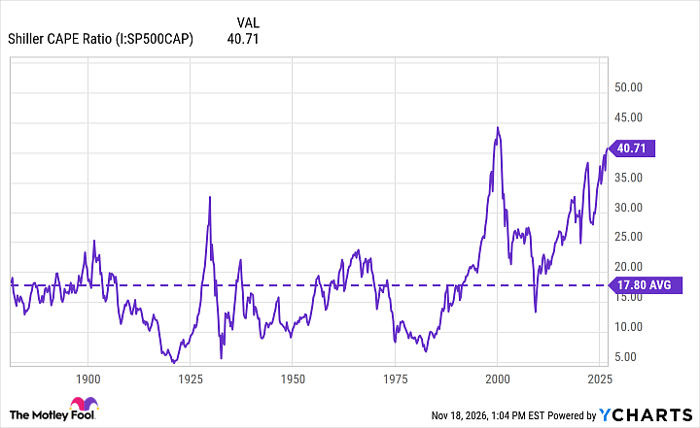
Shiller CAPE Ratio data by YCharts
Six historical CAPE readings reveal an interesting pattern
Looking back over more than a century, there are six notable periods when the CAPE ratio eclipsed 30. Each period provides a useful example of how investor enthusiasm, technological innovation, and monetary policy can influence stock prices.
- September 1929 -- CAPE: 32.5: During the Roaring Twenties, industrial expansion and widespread speculation fueled stock prices sharply higher. Investors increasingly began purchasing stocks with borrowed money. This contributed to an unsustainable market boom that culminated in the October 1929 crash and the subsequent Great Depression.
- December 1999 -- CAPE: 44.2: The rise of the internet influenced enthusiasm for technology companies, many of which commanded enormous valuations despite generating little revenue and no profit. The dot-com bubble eventually burst, sending the Nasdaq plunging 78% from its peak in March 2000 to its trough in October 2002.
- January 2018 -- CAPE: 33.3: A prolonged economic expansion, low interest rates, tax reform, and enthusiasm around big tech helped lift the stock market. However, concerns about Federal Reserve tightening and decelerating global growth eventually contributed to a sharp market correction. The S&P 500 approached bear-market territory by December 2018.
- January 2020 -- CAPE: 30.9: Strong earnings, modest monetary policy, and optimism surrounding the technology sector helped propel valuations above historical benchmarks. The COVID-19 pandemic subsequently triggered a nasty market collapse. Of note, the sell-off was short-lived and driven primarily by an unexpected global health crisis rather than valuation concerns.
- November 2021 -- CAPE: 38.6: Low interest rates, pandemic-era stimulus, and enthusiasm around growth stocks drove an expansion in valuations. As inflation accelerated and the Federal Reserve began preparing for rising interest rates, the market entered a challenging period of digestion that culminated in a bear market in 2022.
- Current day 2026 -- CAPE: 41.0: The latest valuation surge has been driven mostly by AI enthusiasm. In particular, investors are bullish on investments in hyperscaler infrastructure, which they expect to produce exceptional long-term earnings growth for technology, energy, and utility companies.
The common theme here is that historically high valuations frequently accompany periods of optimism. However, the catalysts behind the subsequent declines have varied.

Image source: Getty Images.
Today's CAPE readings suggest the market is overvalued
Nvidia, Microsoft, Alphabet, Amazon, and other technology leaders are committing hundreds of billions of dollars to AI infrastructure every year. Investors anticipate that this capital investment will eventually generate attractive returns.
As stock prices rise faster than inflation-adjusted earnings, the CAPE ratio naturally increases. This suggests that the price investors are paying for each dollar of incremental earnings is becoming more expensive.
As the examples illustrate, elevated CAPE readings have historically been associated with more subdued stock market returns.
Patience is more important than predicting a crash
Despite the CAPE ratio's importance, investors should not treat it as a market-timing indicator. The ratio does not accurately predict when a correction will occur or how severe a downturn might become.
That said, elevated valuations suggest investors should prepare for more modest returns. Rather than panic selling, a more prudent strategy is to maintain a diversified portfolio. This reduces dependence on a handful of expensive technology companies while preserving exposure to long-term economic growth.
Maintaining appropriate liquidity for near-term needs is sensible, but attempting to predict when the market will peak or bottom often results in missing inevitable recoveries. Against this backdrop, periods of heightened volatility can create opportunities to buy financially strong businesses at more attractive prices.
Ultimately, the stock market has endured wars, recessions, financial crises, pandemics, and numerous speculative bubbles while repeatedly recovering and setting new highs over the long term. While history suggests the CAPE ratio may be warning that future returns could be muted, it does not undermine the importance of patience and consistent investing.
Should you buy stock in S&P 500 Index right now?
Before you buy stock in S&P 500 Index, consider this:
The Motley Fool Stock Advisor analyst team just identified what they believe are the 10 best stocks for investors to buy now… and S&P 500 Index wasn’t one of them. The 10 stocks that made the cut could produce monster returns in the coming years.
Consider when Netflix made this list on December 17, 2004... if you invested $1,000 at the time of our recommendation, you’d have $322,605!* Or when Nvidia made this list on April 15, 2005... if you invested $1,000 at the time of our recommendation, you’d have $927,581!*
Now, it’s worth noting Stock Advisor’s total average return is 792% — a market-crushing outperformance compared to 202% for the S&P 500. Don't miss the latest top 10 list, available with Stock Advisor, and join an investing community built by individual investors for individual investors.
See the 10 stocks »
*Stock Advisor returns as of November 19, 2026.
Adam Spatacco has positions in Alphabet, Amazon, Microsoft, and Nvidia. The Motley Fool has positions in and recommends Alphabet, Amazon, Microsoft, Nasdaq, and Nvidia. The Motley Fool has a disclosure policy.
Recommended Articles


