

AMD Stock Price Forecast: Bernstein Sees Server Revenue Doubling by 2027, Shares May Recover to $560

Source Tradingkey

TradingKey - Advanced Micro Devices (AMD) has seen a new competitive signal in its AI business. Anthropic stated during its IPO roadshow that Claude Mythos Preview took about three days to bring the prompt-processing stage of one of its models to a usable performance level on the AMD MI355X GPU, with nearly all relevant underlying compute code ported or written by Claude.

This means AI tools could help lower software adaptation costs for adopting AMD chips, supporting the company in securing more computing workloads. Meanwhile, Bernstein expects its server business revenue to potentially double year over year by 2027. Falling software migration barriers and growing server demand together support AMD in weathering weakness in its PC business.

The "three-day adaptation" disclosed by Anthropic has a clear scope: it targets prompt processing for a single model—specifically, the stage of reading and processing inputs before generating responses—and does not mean the entire training and inference system was migrated within three days.

This is expected to weaken customers' incentive to stay reliant on Nvidia (NVDA) due to migration costs, allowing AMD to compete for orders more on performance, supply capability, and cost of use.

On the other hand, compared with software progress in GPUs, the server CPU business has already demonstrated improvements in pricing and market share. According to Bernstein, AMD's revenue share in the x86 server CPU market rose by about 1 percentage point quarter over quarter to 45.6% in the third quarter, while the average selling price of server CPUs rose by about 12% quarter over quarter and about 34% year over year. This indicates that AMD is capitalizing on growing server demand through higher product value and revenue share.

Bernstein believes AMD's supply chain management capabilities will help it seize this round of expansion opportunities and expects the company's server business revenue to very likely double year over year by 2027.

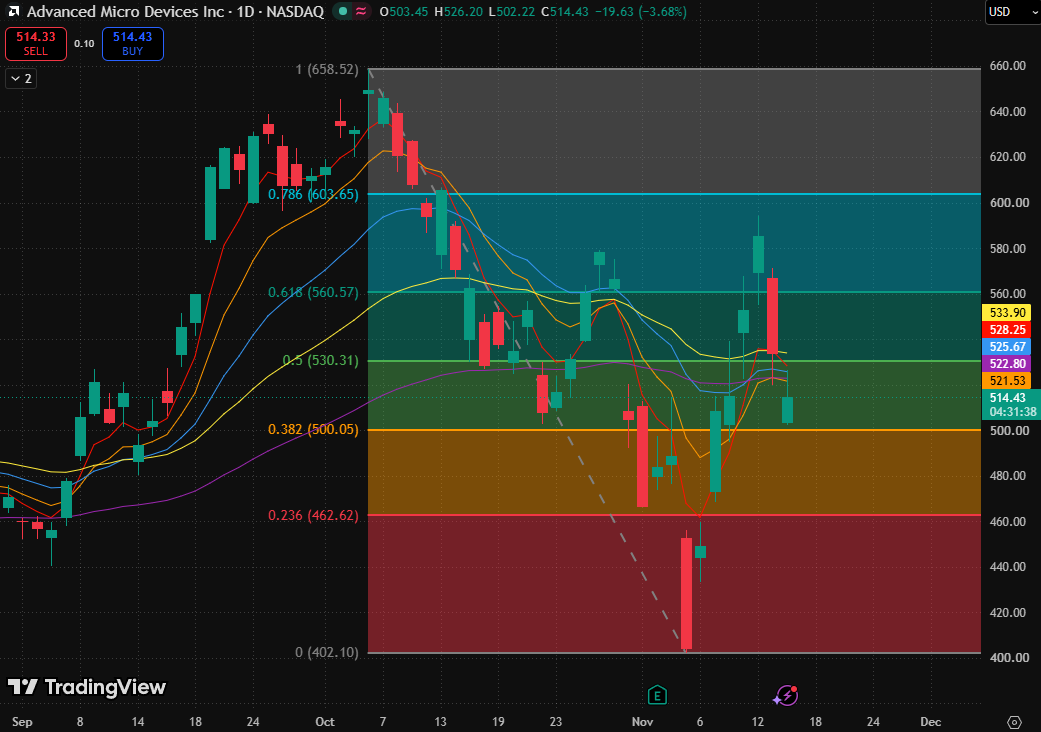
From a technical perspective, AMD is currently in a rebound phase following a lower open after breaking below moving average support, with the current support pivot at the 0.382 Fibonacci retracement level ($500.05). Since the price has not yet broken below this level, it should still initially be treated as a deepening pullback within a rebound; whether the current recovery structure can be preserved will depend on buying support below.
5-d64cacc3cab54f9e8acb89771741d085

AMD stock chart, Source: TradingView

In terms of moving averages, the 5-day exponential moving average ($528.25) continues to fall, and the upward recovery of the 10-day exponential moving average ($521.53) and 20-day exponential moving average ($525.67) has also been interrupted. The 80-day exponential moving average ($533.90) and 160-day exponential moving average ($522.80) are likewise above the current price. The five moving averages are clustered between $521.53 and $533.90, with their cyclical order still intertwined; the price trading below all five moving averages indicates weakening buying support, though it cannot yet be characterized as a complete bearish alignment.

On the upside, focus closely on the moving average zone between $521.53 and $528.25; only if the stock finds buying support on a retest can the rebound turn into a sustained recovery. The primary overhead resistance zone is the $530.31–$533.90 range formed by the 0.5 Fibonacci retracement level and the 80-day exponential moving average; if the stock successfully breaks above this level, it could climb to $560.

The biggest risk is that buying support near $500 is decisively breached and turns into resistance during a rebound. In that scenario, the pullback would enter a lower retracement range, with downside price action first to be observed around $462.62, while the gains from this round of recovery would be further surrendered.

Disclaimer: For information purposes only. Past performance is not indicative of future results.
placeholder
Bitcoin Plunges 13% in a Week as Market Retreats to $60,000 LevelBitcoin plunged 13% over the past seven days as bullish defense lines crumbled in succession, officially kicking off the battle to defend the $60,000 mark.On November 16, following a viol
Author  TradingKey
6 hours ago
Bitcoin plunged 13% over the past seven days as bullish defense lines crumbled in succession, officially kicking off the battle to defend the $60,000 mark.On November 16, following a viol
placeholder
Silver Price Falls Below $50 to Hit Near One-Year Low: Why Is Silver Falling? As of the Asian session on Monday (November 16), silver prices (XAGUSD) extended their recent decline, falling for the third consecutive trading day and dropping nearly 3% intraday to tra
Author  TradingKey
8 hours ago
As of the Asian session on Monday (November 16), silver prices (XAGUSD) extended their recent decline, falling for the third consecutive trading day and dropping nearly 3% intraday to tra
placeholder
Silver Price Forecast: XAG/USD hits yearly lows below $47.50 amid hawkish Fed sentimentSilver price (XAG/USD) extends its losses for the third successive day, trading around $47.50 per troy ounce during Asian hours on Monday. Silver prices fell to a yearly low of $47.34, pressured by a strengthening US Dollar (USD) and elevated Treasury yields.
Author  FXStreet
11 hours ago
Silver price (XAG/USD) extends its losses for the third successive day, trading around $47.50 per troy ounce during Asian hours on Monday. Silver prices fell to a yearly low of $47.34, pressured by a strengthening US Dollar (USD) and elevated Treasury yields.
placeholder
Weekly Report: DXY 103.41, 10-year 5.15%, AUD carry 3bp — three FX regimes flipped in one weekThe dollar index rose 1.09% to 103.41, a 19-month high, while the US 10-year closed at 5.154% and the Australia-US two-year spread collapsed to about 3 basis points from 36. EURUSD fell 1.59% to 1.1024, USDJPY rose 1.51% to 159.78 and AUDUSD fell 1.79% to 0.6764, a 10-month low. Three FX regimes — the broad dollar, the US rate level and the Australian carry premium — flipped in the same week. This report marks the thresholds, ranks which one can flip back first, and lists the week's calendar.
Author  Irene Q.
13 hours ago
The dollar index rose 1.09% to 103.41, a 19-month high, while the US 10-year closed at 5.154% and the Australia-US two-year spread collapsed to about 3 basis points from 36. EURUSD fell 1.59% to 1.1024, USDJPY rose 1.51% to 159.78 and AUDUSD fell 1.79% to 0.6764, a 10-month low. Three FX regimes — the broad dollar, the US rate level and the Australian carry premium — flipped in the same week. This report marks the thresholds, ranks which one can flip back first, and lists the week's calendar.
placeholder
Weekly Report: Gold's $4,000 reclaim and Brent's $100 break were right calls — the silver call was wrongLast week this report said gold's $4,000 reclaim was not the trend and that Brent's supply premium was over. Gold fell 4.7% to $3,884.69 and Brent fell 2.52% to $95.84, so both were right. The call that missed was silver: we read a gold-silver ratio of 78.7 as silver being cheap, and the ratio instead broke above 80 to 81.1 as silver fell 5.35%. This report grades the three calls, explains the miss, and sets this week's scorecard around 3,852 gold, 93.73 Brent and 6.00 copper.
Author  Irene Q.
14 hours ago
Last week this report said gold's $4,000 reclaim was not the trend and that Brent's supply premium was over. Gold fell 4.7% to $3,884.69 and Brent fell 2.52% to $95.84, so both were right. The call that missed was silver: we read a gold-silver ratio of 78.7 as silver being cheap, and the ratio instead broke above 80 to 81.1 as silver fell 5.35%. This report grades the three calls, explains the miss, and sets this week's scorecard around 3,852 gold, 93.73 Brent and 6.00 copper.
goTop
quote