


WMT Holds $123.10 Channel Support Before Earnings, With $131.65 the Next Test
TradingKey - Walmart (NASDAQ: WMT) reports fiscal third-quarter results on Thursday, November 19, before the market opens. The stock goes into the report trading near the lower edge of the rising channel that has carried it higher since September, with $123.10 support just below.
Walmart's market value is close to $1 trillion. Over the past 52 weeks, the stock gained 14.2%, ahead of 12.3% for the S&P 500 and 10% for the consumer staples ETF, according to Barchart. It also reports in a busy week for retail, two days after Home Depot and a day after Target, so investors will be able to compare all three before the holiday season.
The Tariff Refunds Did Not Stay as Profit
In the second quarter, revenue rose 5.9% to $187.9 billion, operating income jumped 28.8% to $9.4 billion, and the gross profit rate, the share of sales left after the cost of goods, rose 0.96 percentage point, mainly because of tariff refunds. Adjusted operating income, which excludes one-time items, rose a smaller 17.4% in constant currency, which strips out exchange-rate moves.
Walmart is not keeping that gain, however. Management said its outlook reflects putting the remaining refunds into lower prices, and the CFO said the refunds received in the second quarter will go toward prices and the customer experience in the second half. He also asked investors to judge the second and third quarters together to see the underlying growth.
As a result, third-quarter guidance is modest. Walmart expects adjusted EPS of $0.62 to $0.64, against $0.62 a year ago, or growth of zero to about 3%. It guided net sales up 3.0% to 3.75% and operating income up 2.0% to 4.0% in constant currency. Barchart puts consensus at $0.64, at the top of that range, and Walmart has beaten estimates in each of its last four quarters.
The Faster-Growing Businesses Carry the Story
Underneath the refunds, the newer businesses kept growing quickly. Advertising rose 38%, both globally and in the US, and e-commerce grew 23% globally and 24% in the US. Membership fee revenue rose 17%. Advertising and membership fees do not require Walmart to buy and stock goods, so investors watch them closely as a source of future profit growth.
The core stores held up too. Walmart US comparable sales, which compare stores open at least a year and exclude fuel, rose 2.6%, with transactions up 1.5% and the average ticket up 1.1%, so more shoppers came in and spent a little more. CEO John Furner said, "At Walmart, they can have it all."
Guidance Leaves Room for a Raise
In August, Walmart raised its fiscal 2027 outlook across the board. It now expects net sales to grow 4.0% to 5.0% in constant currency, up from 3.5% to 4.5%, and adjusted operating income to grow 7.0% to 8.5%, up from 6.0% to 8.0%. Adjusted EPS guidance rose to $2.80 to $2.87, from $2.75 to $2.85.
The Barchart consensus of $2.88 already sits just above that range, so analysts seem to expect another raise on November 19. They also expect $3.22 next year, up about 12%. Of the 39 analysts Barchart tracks, 30 rate the stock a Strong Buy, 6 a Moderate Buy and 3 a Hold.
Valuation and Inventory Are the Risks
At around $126, the stock trades at about 44 times this year's consensus EPS, by my calculation, and average analyst targets of about $129 to $133 sit only a few percent above the price. That leaves little room for a soft quarter. Inventory also rose 6.7% to $61.6 billion in the second quarter, which management tied to strategic initiatives and inflation, so investors will check whether stock levels look right going into the holidays.
Walmart Technical Analysis: Daily Close Above $131.65 Could Open $136.28
That steady demand shows clearly on the daily chart, where the stock has kept its uptrend despite the modest third-quarter guidance. Walmart has climbed neatly inside a rising channel, two parallel lines that have guided prices higher, since September, making steady higher highs and higher lows along the way. After pulling back from $131.65 earlier this month, buyers stepped in near the lower edge of the channel, just above $123.10 support, so the uptrend is still intact. An earnings marker on the chart also points to volatility ahead.
RSI, a momentum gauge that runs from 0 to 100, sits near 65. Momentum is positive, though the MACD, another momentum indicator, has flattened near its signal line, so buyers are not pushing hard right now.
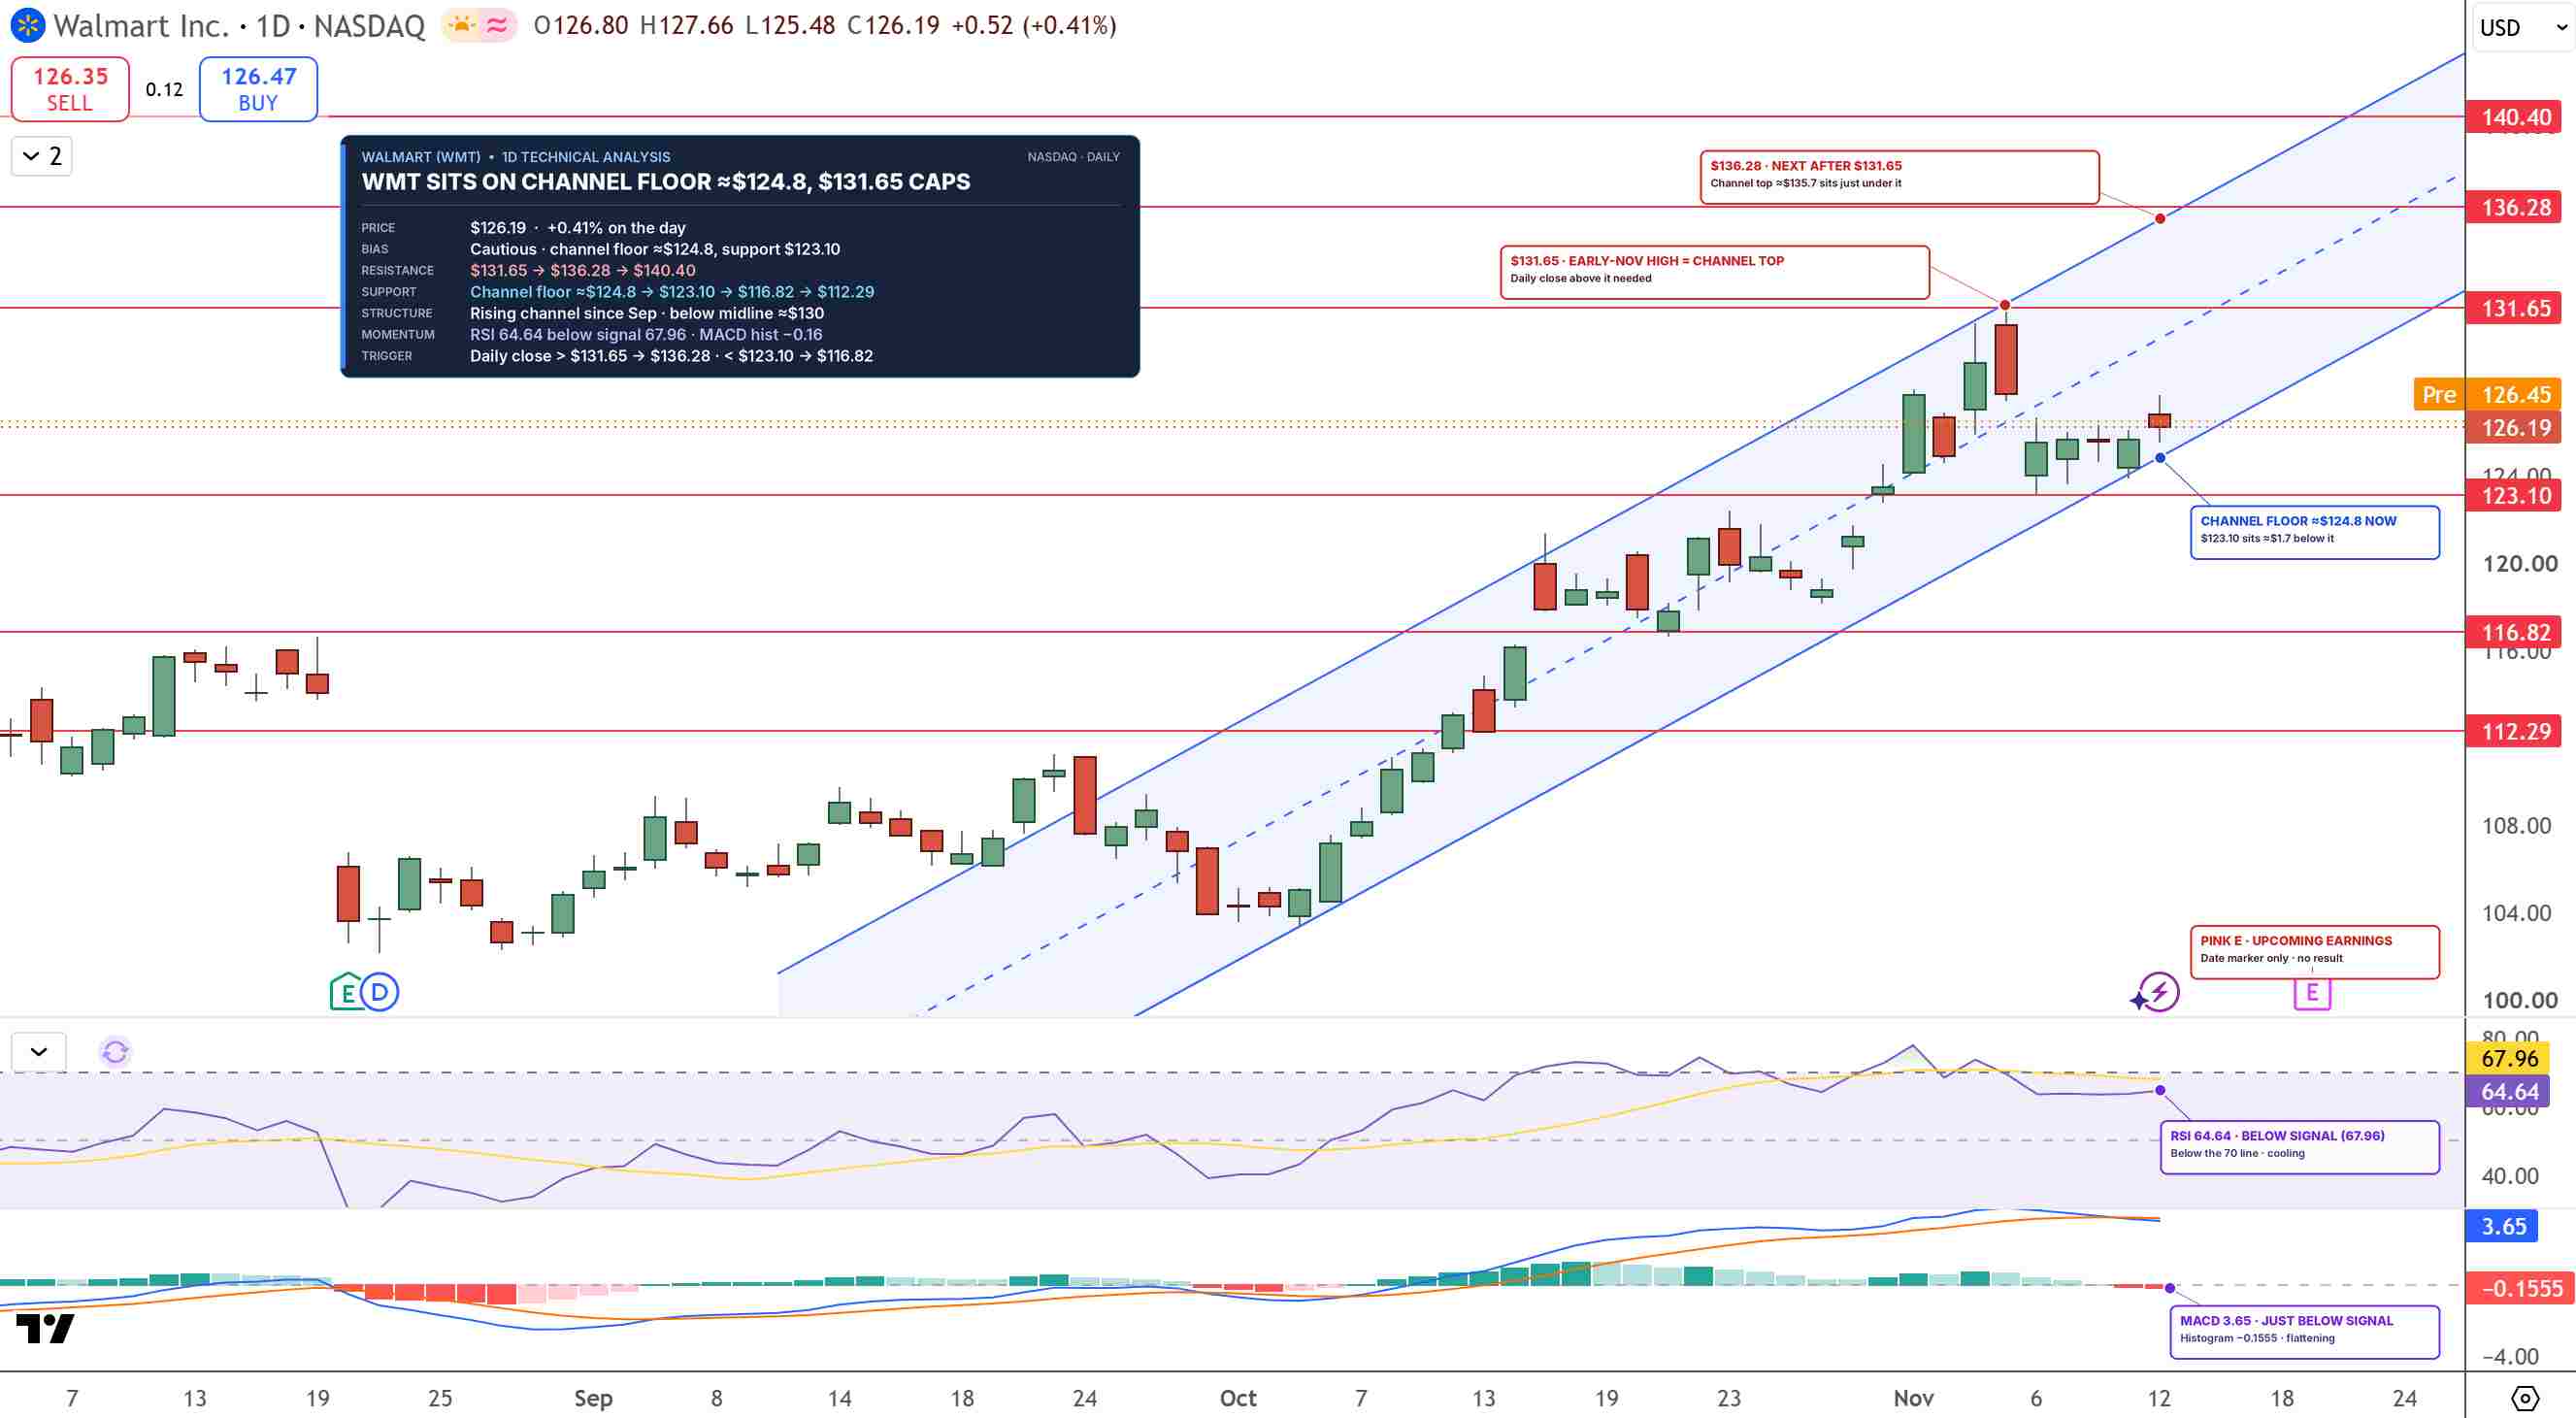
WMT Price Chart - Source: Tradingview
A daily close above $131.65 could open $136.28, followed by $140.40. On the downside, a close below $123.10 would break the channel and could send WMT toward $116.82.
I'm cautiously bullish while WMT holds above $123.10, with $131.65 as the next breakout level.
Key Levels
- Last close: $126.19, up 0.41% on Thursday, November 12 (premarket: $126.45)
- Support: $123.10, $116.82
- Resistance: $131.65, $136.28, $140.40
- RSI: 64.64
- Bullish trigger: Daily close above $131.65
- Bearish trigger: Daily close below $123.10
FAQs
When does Walmart report Q3 earnings?
Walmart reports fiscal third-quarter results on Thursday, November 19, before the market opens. It guided adjusted EPS to $0.62 to $0.64, and consensus sits at $0.64.
What is the Walmart stock forecast before earnings?
The bias is cautiously bullish while WMT holds above $123.10, just below the lower edge of its rising channel. A daily close above $131.65 could open $136.28 and $140.40, while a close below $123.10 could send the stock toward $116.82.
Bottom Line
Walmart is spending its tariff refunds on lower prices rather than keeping them as profit, so Thursday's report rests on advertising, e-commerce and a possible guidance raise. The level that matters is $123.10. In my view, holding it keeps the channel intact with $131.65 next, while a daily close below it would put $116.82 in play.
Recommended Articles


