


The Stock Market's Election Day Rally Just Taught Investors a Crucial Lesson
Key Points
The S&P 500 index rose dramatically the day after the mid-term elections.
Two days after the midterms, the stock market fell sharply, giving up all of the previous day's gains, and then some.
The takeaway: Don't try to time the market.
- 10 stocks we like better than Vanguard S&P 500 ETF ›
Mr. Market was a fictional character created by Benjamin Graham, the man who helped to train Warren Buffett. The stock market's response to the mid-term election results is almost the perfect example of how Mr. Market works in the real world. And all you need to see to understand is two days of performance of Vanguard S&P 500 ETF (NYSEMKT: VOO). Here's a look at Graham's Mr. Market and why the election-day rally is a lesson you'll want to remember for the rest of your life.
Who is Mr. Market?
Benjamin Graham was a famous investor and a teacher at Columbia University. That's where he taught Warren Buffett before hiring the man whose investment success earned him the nickname "The Oracle of Omaha". However, Buffett already knew about Graham because he'd read Graham's seminal investment book, The Intelligent Investor. If you haven't read it, you should. It is filled with timeless investment wisdom.
Missed AI’s "Act 1"? Act 2 Could Be 15x Bigger. Most investors think they missed the AI boat because they didn't buy Nvidia in 2005. But according to our analysts, we’re only at the end of "Act 1"—the R&D phase. "Act 2" is the global rollout. Continue »

Image source: Getty Images.
While the book is a non-fiction work, it includes the fictional character Mr. Market. Mr. Market is your business partner. He is prone to swinging between extreme enthusiasm and extreme pessimism. When he's enthusiastic, he will offer to buy your half of the business for way more than it is worth. When he is pessimistic, he will offer to sell you his half of the business for much less than it is worth.
That, in a fun little story that is easy to understand and relate to, is how the market works. Sometimes stock prices are shockingly high for seemingly no reason. Other times they are so low that it is hard to understand. And Mr. Market's mood swings can happen surprisingly quickly. But Benjamin Graham didn't suggest that investors make rapid-fire trades; instead, he recommended focusing on fundamentals. He often explained that Wall Street is a voting machine in the short term, but a weighing machine over the long term.
Election day and the aftermath
There couldn't have been a better example of the market being a voting machine driven by an emotional Mr. Market than what happened after election day. After election results came in, the market rose dramatically. Then, the very next day, the market gave back all of those gains, and then some. The chart below shows it wasn't just the S&P 500 index that was impacted.
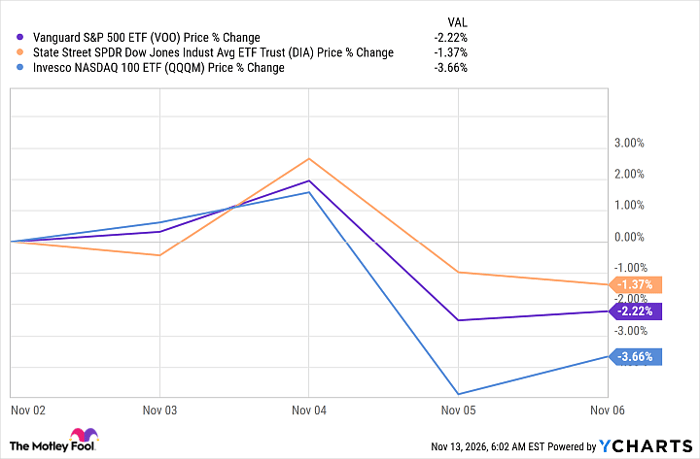
VOO data by YCharts
Investors, as a group, traded like Mr. Market on his optimistic days, only to reverse course and trade like Mr. Market on his pessimistic days. Two days and two very different Mr. Markets. If you were trying to time the market, instead of focusing on a company's fundamentals, you would have been whipsawed (and maybe suffered a little whiplash, too). And, a little over a week later, the indexes have settled back to about where they were before the post-election rally. So all that trading turned out to be a big nothing. If you just sat back and continued to hold a portfolio of well-run companies, that tumultuous period wouldn't have had any lasting impact on your finances.
A lifelong lesson worth remembering
The big takeaway here is that you shouldn't let your emotions drive your investment decisions. That's easy to say, but hard to do. Buffett has long advocated a buy-and-hold strategy, with a focus on company quality. You can apply that to a growth, value, or income approach, but the key is to avoid following along with Mr. Market's mood swings. As the election rally shows, Wall Street's mood can switch very quickly. It is highly unlikely that you will be able to time those swings without eventually getting hurt by them.
Should you buy stock in Vanguard S&P 500 ETF right now?
Before you buy stock in Vanguard S&P 500 ETF, consider this:
The Motley Fool Stock Advisor analyst team just identified what they believe are the 10 best stocks for investors to buy now… and Vanguard S&P 500 ETF wasn’t one of them. The 10 stocks that made the cut could produce monster returns in the coming years.
Consider when Netflix made this list on December 17, 2004... if you invested $1,000 at the time of our recommendation, you’d have $335,171!* Or when Nvidia made this list on April 15, 2005... if you invested $1,000 at the time of our recommendation, you’d have $1,000,640!*
Now, it’s worth noting Stock Advisor’s total average return is 823% — a market-crushing outperformance compared to 208% for the S&P 500. Don't miss the latest top 10 list, available with Stock Advisor, and join an investing community built by individual investors for individual investors.
See the 10 stocks »
*Stock Advisor returns as of November 15, 2026.
Reuben Gregg Brewer has no position in any of the stocks mentioned. The Motley Fool has positions in and recommends Vanguard S&P 500 ETF. The Motley Fool has a disclosure policy.
Recommended Articles


