


Prediction: This Small-Cap Value ETF Will Beat the S&P 500 Over the Next 10 Years
Key Points
Large-cap stocks’ earnings growth (largely driven by AI technology) has justified their long-lived leadership.
The economic and environmental backdrop is changing in a way that could alter market leadership.
The biggest laggards of the past few years may be on the verge of becoming leaders again, as part of a long-established cyclical ebb and flow.
- Motley Fool Issues Rare "Total Conviction" Buy Alert ›
Most investors know that artificial intelligence stocks are responsible for the bulk of the broad market's gains since the 2022 bear market. What's not quite as obvious is that most of this strong performance was led by large-cap stocks. The S&P 500 (SNPINDEX: ^GSPC), a market cap-weighted index, is up about 110% since the current bull market began.
For perspective, the S&P 600 Small Cap Index has only gained 72% over the same period. Growth stocks have also outpaced value stocks during this stretch.
Missed Nvidia in 2009? This Rare Signal Is Flashing Again. In 2009, a "Double Down" signal flashed for a little-known chipmaker called Nvidia. For the first time in years, that same "Total Conviction" signal is flashing for a company 1/100th the size of Nvidia. Continue »
As the old adage goes, though, nothing lasts forever. The cyclical underpinnings of this disparate performance may be on the verge of reversing, working against large-cap stocks -- and AI mega caps in particular -- and in favor of small-cap stocks. Specifically, they're working in favor of small-cap value stocks.
This changing dynamic bodes well for a holding like the Vanguard Morningstar Small-Cap Value ETF (NYSEMKT: VBR), which could end up outperforming the S&P 500 and its exchange-traded funds (ETFs), like the SPDR S&P 500 ETF Trust (NYSEMKT: SPY), over the coming decade.
It's already happening, in fact.
Time for a change
It's gone largely unnoticed due to the inordinate amount of noise of late. But small-cap value stocks have handily beaten the S&P 500's year-to-date gain of just over 12%, with nearly a 20% gain of their own.
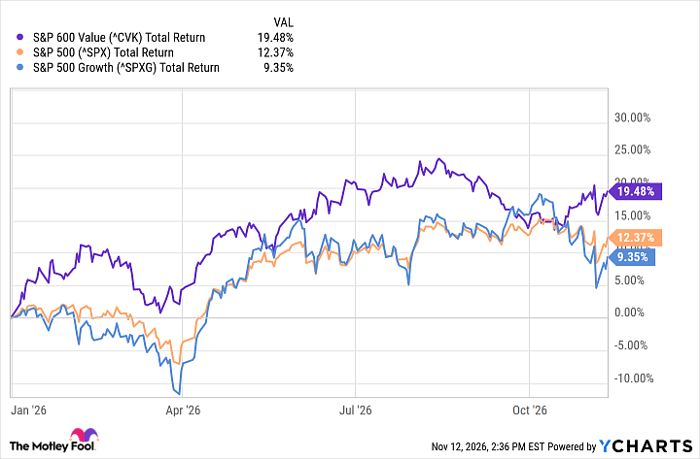
^CVK data by YCharts.
Granted, much of this gap is the result of several AI stocks recently running into a wall of fiscal reality. It's also a shift that's been brewing quietly for a while, waiting for the right time to take hold.
That time may be now. As asset management outfit AllianceBernstein's analysts highlighted earlier this year (based on numbers from FactSet), "[T]he Russell 2000 earnings growth is now expected to outpace S&P 500 profits through the second half of 2026 and 2027." The analysis adds, for good measure: "[T]he sector profile of small-caps transcends AI themes." At the same time, data from Yardeni Research indicates that the S&P 600's forward-looking price-to-earnings (P/E) ratio currently stands at just over 14, which is actually below its long-term average. It could take a decade to renormalize these valuations.
Conversely, the S&P 500's cyclically adjusted price-to-earnings (CAPE) ratio currently stands near a multi-decade high around 40, last seen in early 2000. Although its more familiar trailing P/E ratio of 22 and forward-looking P/E ratio of 19 are both lower, both are also still somewhat above their long-term norms.

Image source: Getty Images.
If nothing else, mutual fund outfit Fidelity notes that, since 1929, small-caps and large-caps trade market leadership positions an average of every seven years. Last year was the 12th year of large-caps' leadership.
A balanced portfolio is still a must
The prediction isn't etched in stone. Something could change in the meantime to disrupt this dynamic.
If you're playing the odds, though, the smart-money move is still betting on the information you have rather than attempting to predict the unpredictable and the unlikely. The market's clearly capable of throwing occasional unexpected curveballs, but they're the exception to the norm rather than the norm.
Of course, you can protect your portfolio from such unknowns by also owning quality large-caps capable of overcoming their group's underperformance.
Should you buy stock in Vanguard Morningstar Small-Cap Value ETF right now?
Before you buy stock in Vanguard Morningstar Small-Cap Value ETF, consider this:
The Motley Fool Stock Advisor analyst team just identified what they believe are the 10 best stocks for investors to buy now… and Vanguard Morningstar Small-Cap Value ETF wasn’t one of them. The 10 stocks that made the cut could produce monster returns in the coming years.
Consider when Netflix made this list on December 17, 2004... if you invested $1,000 at the time of our recommendation, you’d have $335,171!* Or when Nvidia made this list on April 15, 2005... if you invested $1,000 at the time of our recommendation, you’d have $1,000,640!*
Now, it’s worth noting Stock Advisor’s total average return is 823% — a market-crushing outperformance compared to 208% for the S&P 500. Don't miss the latest top 10 list, available with Stock Advisor, and join an investing community built by individual investors for individual investors.
See the 10 stocks »
*Stock Advisor returns as of November 14, 2026.
James Brumley has no position in any of the stocks mentioned. The Motley Fool has no position in any of the stocks mentioned. The Motley Fool has a disclosure policy.
Recommended Articles


