


AMD Nears $600 Mark in Five-Day Rally as Nvidia Faces Pressure, May Gain Another 9% to Challenge Previous High on Breakout
TradingKey - Nvidia (NVDA) management changes prompted the market to reassess the competitive landscape of the AI chip industry, with capital starting to flow into alternatives such as AMD (AMD). AMD gained 5.86% on Thursday to close at $585.30 after touching an intraday high of $594, marking its fifth consecutive session of gains. Over the past week, the stock has rebounded by approximately 30%, sitting just a step away from the $600 psychological threshold.
Following leadership turmoil at Nvidia, investors have begun betting that major cloud computing companies may accelerate the diversification of their chip supply to reduce reliance on a single vendor. William Blair upgraded AMD to "Buy," citing an opportunity for the company to expand its AI accelerator market share, while Bank of America maintained its Buy rating with a $700 price target.
Recent performance has also provided fundamental support for the share price rebound, with AMD's latest quarterly revenue reaching approximately $13.38 billion, data center business growing 97% year-over-year, and adjusted earnings per share coming in at $2.09.
Source: TradingView
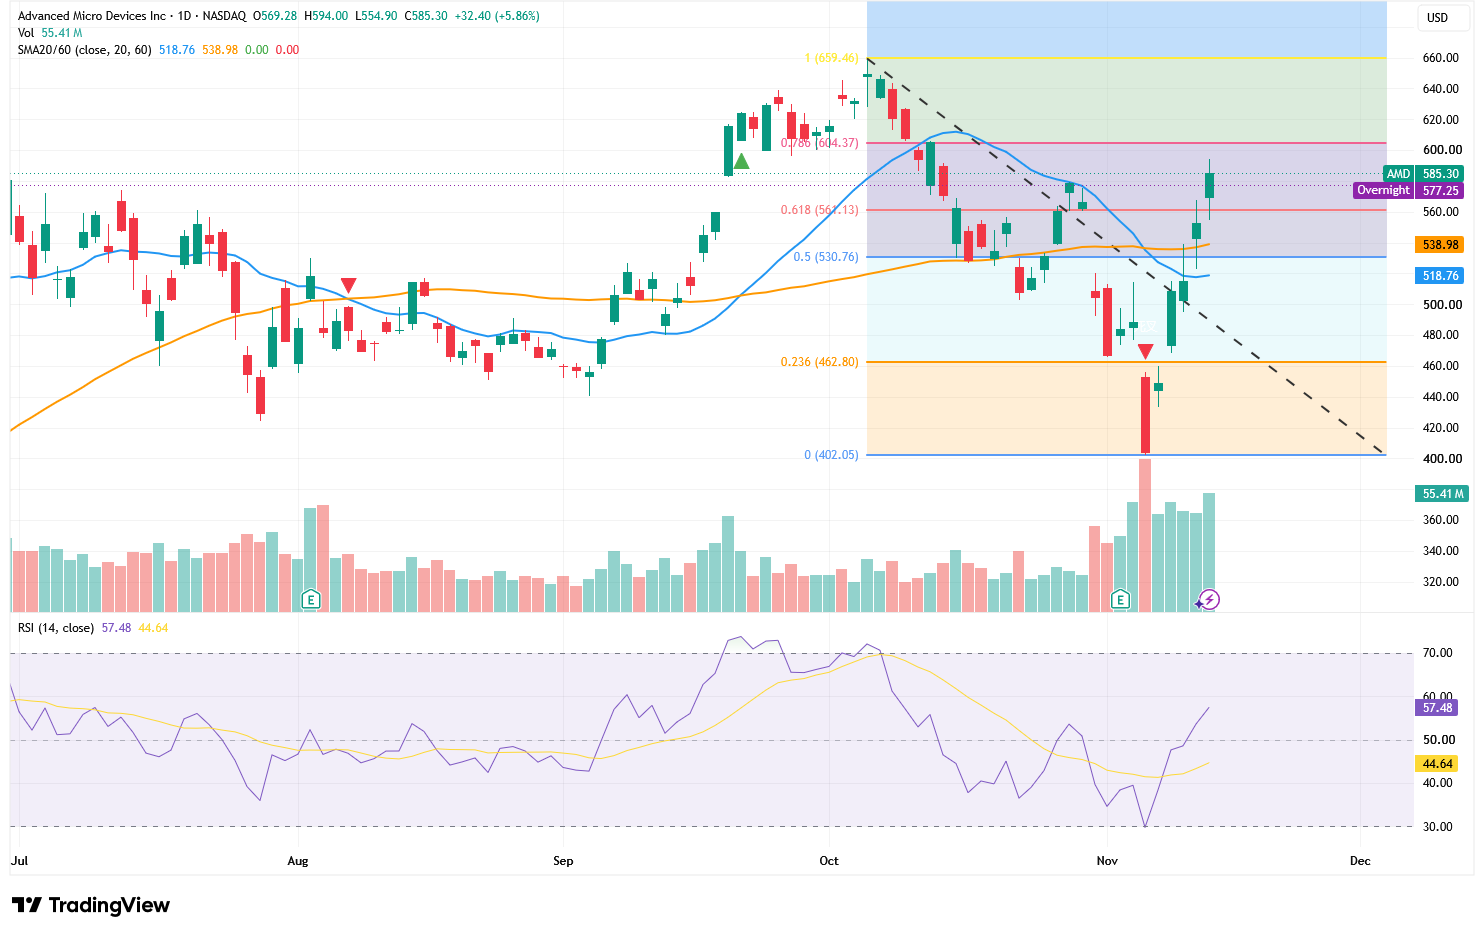
From a technical perspective, AMD has broken out of the downtrend line extending from its October high, while reclaiming both the 20-day moving average of $518.76 and the 60-day moving average of $538.98, shifting its short-term structure from weak to strong. The stock also recovered the 61.8% Fibonacci retracement level at $561.13, turning this previous resistance into new support.
To the upside, attention should first focus on the $600 to $604 area, where $604.37 corresponds to the 78.6% Fibonacci retracement level and, together with the $600 psychological barrier, forms strong resistance. On Thursday, the stock retreated after nearing this area intraday, indicating that some short-term capital has begun locking in profits. If AMD can break through $604 on heavy volume and post consecutive closes above it, the next target will be the October previous high of $659.46, representing about 9% upside from the breakout point.
The 14-day RSI has continued to rebound from oversold territory to 57.48, well above the smoothed signal line of 44.64, indicating that buying momentum has taken control. Meanwhile, the RSI has not yet entered the overbought zone above 70, theoretically leaving room for further upside. However, given the substantial short-term run-up, repeated oscillations around $600 may occur if volume fails to continue expanding.
Initial support below lies at $561; if a pullback holds this level, the current breakout structure remains valid. Further support is concentrated between $539 and $531, corresponding to the 60-day moving average and the 50% Fibonacci retracement level. Once the stock breaks back below $531, the strong structure built by the five-session winning streak will weaken significantly, and the price could fall back toward around $519.
Recommended Articles


