


This 1 Investing Rule Has Protected Long-Term Investors in Every Market Crash
Key Points
The market has seemingly gone up and to the right for over four years now.
But it's likely there will be another recession and/or market crash at some point.
The good news is that long-term investors have a clear playbook to navigate this.
- 10 stocks we like better than S&P 500 Index ›
While history suggests stocks will perform well in the 12 months following the midterm elections, it's important to remember that while history often rhymes, it rarely repeats itself.
Given everything going on in the economy and stock market, I suspect history will play out, but I also wouldn't be surprised if the market took a nasty turn. The Iran war is still ongoing, inflation remains above the Federal Reserve's 2% target, and investors can't seem to make heads or tails of what's going on with artificial intelligence.
Missed AI’s "Act 1"? Act 2 Could Be 15x Bigger. Most investors think they missed the AI boat because they didn't buy Nvidia in 2005. But according to our analysts, we’re only at the end of "Act 1"—the R&D phase. "Act 2" is the global rollout. Continue »
Additionally, the economy is overdue for a recession. A market crash is not out of the question. Luckily, one investing rule has protected long-term investors in every market crash.

Image source: Getty Images.
What to do if a market crash occurs
While it's impossible to know when one will occur, I don't believe the broader benchmark S&P 500 (SNPINDEX: ^GSPC) has seen its last market crash, and they often come out of nowhere. For instance, the market fell 20% in 2022 after a strong year in 2021, even as many analysts had expected the rally to continue.
So investors should always be prepared for the worst. The good news is that, while market crashes can make investors feel as if the end of the world is approaching, they're often only a temporary blip in the stock market's long-term ascent.
That's why the No. 1 rule for long-term investors is never to panic-sell during a market crash. Doing so often results in investors losing money. It's important to understand that stocks often sell off alongside the market for no other reason than that investors are worried and want to move into cash.
History shows that bear markets are shorter than bull markets and that the market rebounds for those who are patient. Data published by Charles Schwab in 2025 showed that there have been six bear markets since 1980, in which the broader market has fallen by at least 20%.
And if you look at all the past corrections in this time period, in which the S&P 500 falls at least 10%, you'll actually notice that on several other occasions, the market got very close to a bear market before reversing course.
According to Schwab, the average bear market lasted 409 days, or just over a year, while the average loss was 36%.
Now, these downturns likely felt awful while they were happening, but Schwab's data also showed that the average bull market lasted 1,894 days and resulted in an average return of 182.5%.
What to do when a bear market hits
As you can see above, the data show that long-term investors who simply wait out a bear market and avoid panic selling will eventually see strong gains for their portfolios. Consider everything the market has overcome in the 21st century.
There's been the dot-com bubble of 2000, the housing bubble and the Great Recession of 2008, the COVID-19 pandemic, the Fed's intense rate-hiking campaign in 2022 and 2023, the Silicon Valley Bank crash in 2023, Trump's tariff hikes last year, and now the Iran war this year.
Yet, the market has performed strongly through it all.
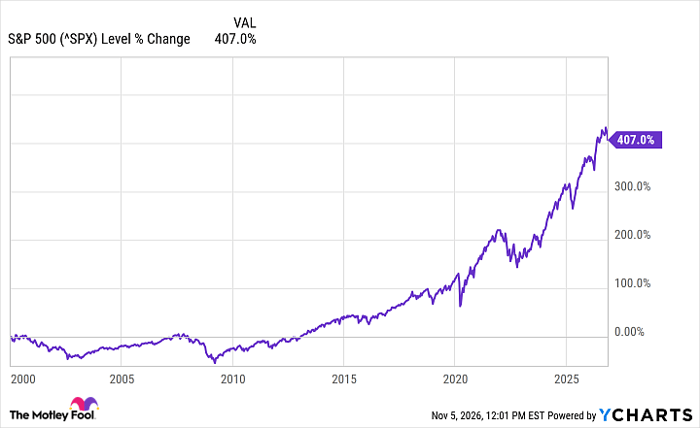
^SPX data by YCharts
Now, I'm not saying to never sell any of your stocks if they decline or to always buy the dip. If a recession hits or other significant factors affect the market, such as persistent inflation and higher interest rates, companies could perform poorly.
Every so often, investors need to review their portfolios and ensure the individual stocks they own, if any, have strong enough business models and balance sheets to navigate a much more difficult environment.
If a company experiences headwinds for a few quarters, that's perfectly fine and just a part of the business cycle. But they have to make it to the other side of the bear market. If a long-term thesis has fundamentally changed, you should consider selling that stock.
Typically, most companies can endure, so you should never panic-sell if you don't have to. But it's important to do the work and be sure you know what you own.
Should you buy stock in S&P 500 Index right now?
Before you buy stock in S&P 500 Index, consider this:
The Motley Fool Stock Advisor analyst team just identified what they believe are the 10 best stocks for investors to buy now… and S&P 500 Index wasn’t one of them. The 10 stocks that made the cut could produce monster returns in the coming years.
Consider when Netflix made this list on December 17, 2004... if you invested $1,000 at the time of our recommendation, you’d have $344,878!* Or when Nvidia made this list on April 15, 2005... if you invested $1,000 at the time of our recommendation, you’d have $1,097,846!*
Now, it’s worth noting Stock Advisor’s total average return is 852% — a market-crushing outperformance compared to 208% for the S&P 500. Don't miss the latest top 10 list, available with Stock Advisor, and join an investing community built by individual investors for individual investors.
See the 10 stocks »
*Stock Advisor returns as of November 10, 2026.
Charles Schwab is an advertising partner of Motley Fool Money. Bram Berkowitz has no position in any of the stocks mentioned. The Motley Fool recommends Charles Schwab and recommends the following options: short September 2026 $95 calls on Charles Schwab. The Motley Fool has a disclosure policy.
Recommended Articles


