


The Stock Market Is Doing Something for Only the 5th Time in 30 Years, and History Is Crystal Clear on What Comes Next for Stocks
Key Points
A confluence of factors, including the artificial intelligence (AI) infrastructure build-out, has helped to blast the Dow Jones Industrial Average, S&P 500, and Nasdaq Composite to all-time highs.
The second-priciest stock market in history is sounding an alarm on Wall Street.
History is a two-way street that undeniably favors optimists.
- 10 stocks we like better than S&P 500 Index ›
For patient investors, Wall Street's four-year (and counting) bull market has been rewarding. Since the 2022 bear market reached its trough, the ageless Dow Jones Industrial Average (DJINDICES:^DJI), benchmark S&P 500 (SNPINDEX:^GSPC), and innovation-driven Nasdaq Composite (NASDAQINDEX:^IXIC) have all soared to all-time highs.
Several factors have powered the wind in the stock market's sails, including:
Missed AI’s "Act 1"? Act 2 Could Be 15x Bigger. Most investors think they missed the AI boat because they didn't buy Nvidia in 2005. But according to our analysts, we’re only at the end of "Act 1"—the R&D phase. "Act 2" is the global rollout. Continue »
- The artificial intelligence (AI) infrastructure build-out
- Better-than-expected corporate earnings
- The arrival and early-stage adoption of quantum computing
- Euphoria surrounding record-breaking initial public offerings
- Record share repurchases by S&P 500 companies
While history plainly shows that the Dow, S&P 500, and Nasdaq Composite rise over long periods, it also tells us that bull markets aren't indefinite. For seemingly every catalyst, there's a headwind waiting to upend the stock market's AI-driven rally.
Image source: Getty Images.
We're currently witnessing the stock market do something for only the fifth time over the last 30 years -- and history has made it crystal clear that when this signal appears, a significant directional shift in equities soon follows.
This has only been observed five times since the end of 1996
Although numerous stock market headwinds stand out at the moment, such as the parabolic jump in outstanding margin debt and the rapid rise in long-duration Treasury bond yields, arguably no downside catalyst speaks louder than premium stock valuations.
"Value" is one of the most challenging subjects to tackle on Wall Street, primarily because there isn't a one-size-fits-all way to evaluate and value every individual company and the broader market. The valuation process introduces subjectivity and emotion, making it virtually impossible to accurately predict short-term directional moves in individual stocks and Wall Street's major stock indexes.
While no indicator can ever guarantee what's to come, some past events can be excellent teaching tools for those investors willing to listen. One such indicator, with a flawless track record of foreshadowing short-term directional moves in the Dow, S&P 500, and Nasdaq Composite, is the S&P 500's Shiller Price-to-Earnings (P/E) Ratio, also known as the Cyclically Adjusted P/E Ratio (CAPE Ratio).
The Shiller P/E Ratio is based on average inflation-adjusted earnings over the trailing 10 years, meaning that recessions, which can turn corporate earnings negative over a short time frame, won't minimize the usefulness of this valuation tool.
Stock Market Shiller PE Ratio on the verge of taking out its Dot Com Bubble all-time high 🚨 🤯 👀 https://t.co/CtCmSgWnLt
— Barchart (@Barchart) July 11, 2026
When backtested over the last 156 years, the S&P 500's Shiller P/E Ratio has averaged 17.44. On Oct. 30, this time-tested valuation tool closed at a multiple of 40.13 -- 130% above its long-term average.
Over the last 30 years, the Shiller P/E has exceeded 30 on five occasions, including the present, and the stock market took a significant tumble following each of the previous four instances:
- June 1997 to August 2001: During the internet frenzy of the mid-to-late 1990s, investors demonstrated a willingness to pay hefty premiums (the CAPE Ratio reached its all-time high of 44.19 in December 1999) and take big risks for high-growth internet stocks. After the dot-com bubble burst in March 2000, the S&P 500 and Nasdaq Composite lost 49% and 78% before finding their respective bottoms.
- September 2017 to November 2018: The CAPE Ratio again exceeded 30 as hype surrounding blockchain technology took shape. During the fourth quarter of 2018, Wall Street's benchmark index shed roughly 20% of its value.
- December 2019 to February 2020: In the lead-up to the COVID-19 crash of February-March 2020, the Shiller P/E yet again surpassed 30. The COVID-19 crash wiped away 34% of the S&P 500's value in just 33 calendar days.
- August 2020 to May 2022: Investors' willingness to take risks and pay hearty valuation premiums returned when the U.S. government doled out several rounds of fiscal stimulus during the pandemic. The CAPE Ratio peaked at just above 40 in January 2022. However, the nine-month-long bear market in 2022 lopped roughly 20%, 25%, and 33% off the Dow, S&P 500, and Nasdaq, respectively.
- November 2023 to present: The AI revolution has made this the second-priciest stock market in history, with the CAPE Ratio peaking at 42.84 in early June.
To be clear, the S&P 500's Shiller P//E Ratio can't tell us when stocks will peak or which catalysts will push the broader market over the edge. What it does show is that premium valuations have historically foreshadowed significant downside in the stock market.

Image source: Getty Images.
History is a two-way street
If history were to rhyme, which is pretty common on Wall Street, a 20% or greater pullback should be expected in one or more of Wall Street's major stock indexes. Given that this is the second-priciest stock market, history would suggest that a pullback of more than 35% to drop the Shiller P/E below 30 may be warranted.
While this isn't the rosiest of forecasts for investors, it's worth noting that history is a two-way street -- and it tends to favor optimists far more than pessimists.
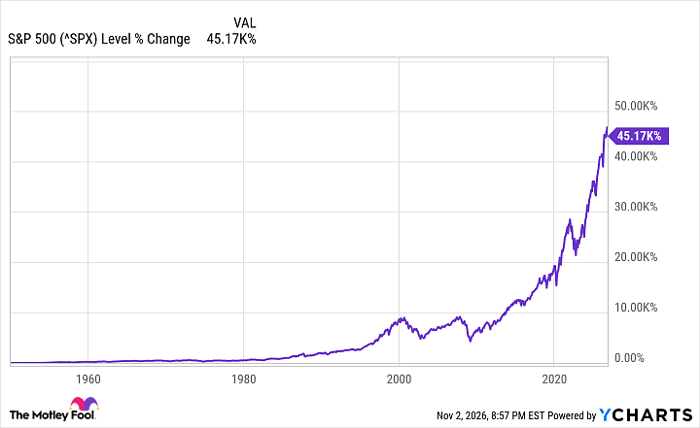
On the one hand, bear market declines are akin to the price of admission for investing in one of the greatest wealth creators on the planet. On the other hand, downturns share a common theme: they're short-lived.
^SPX data by YCharts.
In late May, Bespoke Investment Group calculated the length of every S&P 500 bull and bear market since the start of the Great Depression in September 1929. This yielded 54 events, with 27 separate bull and bear markets.
Whereas the average S&P 500 bear market has lasted just 286 calendar days, the typical bull market has endured for almost 3.6 times as long (1,023 calendar days). From a statistical standpoint, the stock market rises far more often than it declines.
Furthermore, as noted earlier, the Dow Jones Industrial Average, S&P 500, and Nasdaq Composite have rich histories of rising over long periods. According to data from Crestmont Research, the S&P 500 hasn't declined over any rolling 20-year period, including dividends, dating back to 1900.
Put in another context, no matter how dismal the short-term outlook for the stock market has appeared, the S&P 500 has successfully climbed this wall of worry every time. Even if stocks tumble in the not-too-distant future, long-term optimists will be sitting pretty.
Should you buy stock in S&P 500 Index right now?
Before you buy stock in S&P 500 Index, consider this:
The Motley Fool Stock Advisor analyst team just identified what they believe are the 10 best stocks for investors to buy now… and S&P 500 Index wasn’t one of them. The 10 stocks that made the cut could produce monster returns in the coming years.
Consider when Netflix made this list on December 17, 2004... if you invested $1,000 at the time of our recommendation, you’d have $341,966!* Or when Nvidia made this list on April 15, 2005... if you invested $1,000 at the time of our recommendation, you’d have $1,146,819!*
Now, it’s worth noting Stock Advisor’s total average return is 852% — a market-crushing outperformance compared to 203% for the S&P 500. Don't miss the latest top 10 list, available with Stock Advisor, and join an investing community built by individual investors for individual investors.
See the 10 stocks »
*Stock Advisor returns as of November 7, 2026.
Sean Williams has no position in any of the stocks mentioned. The Motley Fool has no position in any of the stocks mentioned. The Motley Fool has a disclosure policy.
Recommended Articles


