


Is a Stock Market Crash Coming in 2026? Here's What Decades of History Suggest.
Key Points
Historically, when the market becomes too expensive, it crashes.
Today's high AI spend is reminiscent of the spend preceding the 2000 dot-com crash.
High inflation and interest rates could be tough on the economy and on businesses.
- 10 stocks we like better than S&P 500 Index ›
The S&P 500 (SNPINDEX: ^GSPC) is up 10.8% this year, but it's been falling over the past few weeks. If it falls any lower, it will break its streak of double-digit annual gains over the past four years.
Between soaring artificial intelligence (AI) spend, high inflation, steady interest rates, and the results of Tuesday's U.S. midterm election, there's a lot going on in the market. It's teetering now, but will there be an all-out market crash before the year is out? Here's what decades of history suggest.
Missed AI’s "Act 1"? Act 2 Could Be 15x Bigger. Most investors think they missed the AI boat because they didn't buy Nvidia in 2005. But according to our analysts, we’re only at the end of "Act 1"—the R&D phase. "Act 2" is the global rollout. Continue »
Markets can't be too expensive for an extended period
A century of data gives today's investors a lot of information. For example, investors know today that if the market becomes too expensive, it's going to crash. It's just a matter of time.
The standard metric to determine that is the CAPE ratio, or cyclically adjusted price-to-earnings (P/E) ratio. This measures the average 10-year P/E ratio adjusted for inflation.
The average, back-measured for more than 100 years, is 17.8. It first reached a record high before the 1929 market crash, and since then, it reached a new high of 44 right before the dot-com crash in 2000.
There's been only one other time it has surpassed 40, and that was earlier this year.
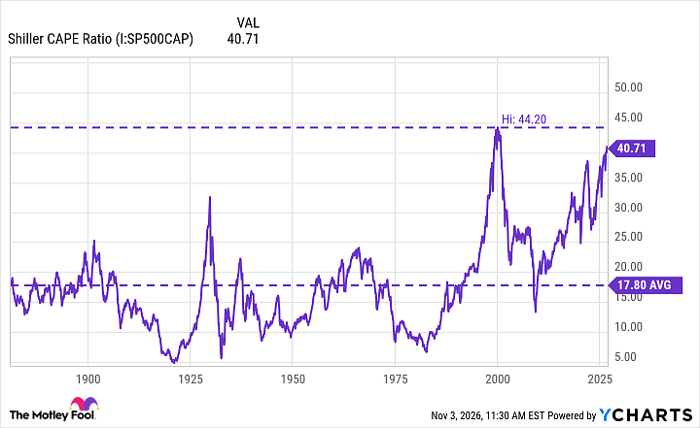
Shiller CAPE Ratio data by YCharts.
In 2000, the crash didn't happen right away. The CAPE ratio was above 40 for nearly an entire year before the market crashed. This year, the 40 mark wasn't passed until the end of May.
History doesn't have to repeat. The market could stay elevated for longer than a year, or the crash could happen sooner. But it isn't likely to wait too long.
The other historical signals
The valuation isn't the only similarity to the dot-com crash. At that time, new internet companies were sprouting up and taking on high debt. It wasn't unlike the massive spending on AI from tech companies today.
There are differences, though. The companies that overspent in the dot-com bubble were largely untested and unprofitable, whereas today, they are well-established tech giants like Amazon and Alphabet. However, these two companies in particular are already free-cash-flow negative from all of their spending.
Then there are the general signals, like inflation and high interest rates. Interest rates are often raised to combat high inflation, and together, they can be rough on the economy. As prices soar, people can't afford to spend, resulting in poor business performance. As interest rates rise, companies can't borrow as much to operate their businesses. Together, they're a double whammy for the market.

Image source: Getty Images.
The most famous example is probably the 1973 oil crisis. There was an oil embargo from the Middle East on top of Vietnam War spending, and inflation skyrocketed. The Federal Reserve raised interest rates to as high as 10.78%, and the stock market lost 51.9% between 1973 and 1974.
There is actually good news
The good news is that investors and economists have had all of these events to learn from. It's highly unlikely that there will be any need to get to 10.78% interest rates, and today's high oil prices and the Iran war are far from an oil embargo.
In other words, even if there is a market crash -- whether before the end of the year or sometime in the future -- it may not be as crushing as it was in the past. Consider the most recent crash, when the S&P 500 slid at the onset of COVID-19 and lost 34% within just over a month. By the middle of August, it was already notching new highs.
Finally, if you're properly prepared for whenever the crash happens, your portfolio should stay resilient and bounce back in better times.
Should you buy stock in S&P 500 Index right now?
Before you buy stock in S&P 500 Index, consider this:
The Motley Fool Stock Advisor analyst team just identified what they believe are the 10 best stocks for investors to buy now… and S&P 500 Index wasn’t one of them. The 10 stocks that made the cut could produce monster returns in the coming years.
Consider when Netflix made this list on December 17, 2004... if you invested $1,000 at the time of our recommendation, you’d have $341,966!* Or when Nvidia made this list on April 15, 2005... if you invested $1,000 at the time of our recommendation, you’d have $1,146,819!*
Now, it’s worth noting Stock Advisor’s total average return is 852% — a market-crushing outperformance compared to 203% for the S&P 500. Don't miss the latest top 10 list, available with Stock Advisor, and join an investing community built by individual investors for individual investors.
See the 10 stocks »
*Stock Advisor returns as of November 7, 2026.
Jennifer Saibil has no position in any of the stocks mentioned. The Motley Fool has positions in and recommends Alphabet and Amazon. The Motley Fool has a disclosure policy.
Recommended Articles


