


Rivian Stock Forecast: RIVN Bounces Off $11.37 After Q3 Beat, With $12.65 the First Test
TradingKey - Rivian Automotive (NASDAQ: RIVN) jumped 6.20% to $12.16 on Friday, October 30, after third-quarter results beat estimates and the company raised its delivery guidance. Volume reached about 63 million shares, more than double the 24 million average.
The gain stood out on a weak day, with the Nasdaq down 2.86%, the S&P 500 down 1.82% and Lucid down about 5.6%. Rivian had hit a 52-week low of $11.38 just before the report, and it remains down about 40% this year and about 46% below its 52-week high of $22.69.
Q3 Beat Estimates
Revenue rose 38% to $2.16 billion, above the roughly $2 billion analysts expected. The adjusted loss, which excludes items such as stock-based pay, narrowed to $0.48 a share from $0.65 a year ago, against expectations of about $0.61 to $0.62. Adjusted EBITDA, a rough measure of operating cash profit, was a loss of $435 million, better than the roughly $576 million loss expected. The net loss narrowed to $913 million from $1.17 billion.
Deliveries rose 46% to 19,248 vehicles, and production reached 19,751. CEO RJ Scaringe said the R2, Rivian's cheaper midsize SUV, was its best-selling model by volume in the quarter.
Software Is Carrying the Car Business
Automotive revenue rose 36% to $1.55 billion, helped by about $80 million more in regulatory credit sales, credits Rivian sells to other carmakers that need them to meet emissions rules. The car business still posted an $80 million gross loss, though that was narrower than $130 million a year ago despite about $120 million of extra costs from ramping the R2.
Software and services revenue rose 45% to $605 million, about 28% of total revenue, with a $256 million gross profit. More than half of that revenue, $354 million, came from Rivian's joint venture with Volkswagen. That profit lifted consolidated gross profit to $176 million.
Guidance Raised
Rivian raised its 2026 delivery outlook to 67,000 to 70,000 vehicles from 65,000 to 70,000. It improved its adjusted EBITDA loss forecast by $100 million at the midpoint, to about $1.8 billion, and cut its capex plan by $300 million at the midpoint. Interim CFO Derek Mulvey said the company expects the R2 "will help us achieve a positive automotive gross margin exit rate for the year."
Cash Burn Is the Weak Spot
Free cash flow, the cash left after operating costs and capital spending, was negative $1.12 billion in the third quarter, worse than negative $421 million a year earlier. Operating cash outflow of $758 million reflected lower deferred revenue and higher R2 inventory purchases. Rivian says it has about $13 billion of total available liquidity, including targeted future capital commitments, to fund the R2 ramp and its Georgia factory.
Analysts Are Split
Jefferies upgraded the stock to Buy from Hold with a $17 target, calling the recent decline an attractive entry point as Rivian moves toward positive automotive margins. Mizuho cut its target to $10 from $13 and kept an Underperform rating.
Rivian Technical Analysis: Daily Close Above $12.65 Could Open $13.45
That shift in sentiment shows clearly on the daily chart. Buyers firmly defended $11.37, the bottom of the recent selloff and close to the 52-week low, after RSI dipped into oversold territory. Even so, RIVN still trades below the 50-day EMA at $13.98 and the 100-day EMA at $14.80, exponential moving averages that give more weight to recent prices, so the bigger trend remains bearish.
RSI, a momentum gauge that runs from 0 to 100, has climbed to about 37, and the MACD, another momentum indicator, is nearing a bullish signal-line crossover while remaining below zero. Both suggest selling pressure is easing.
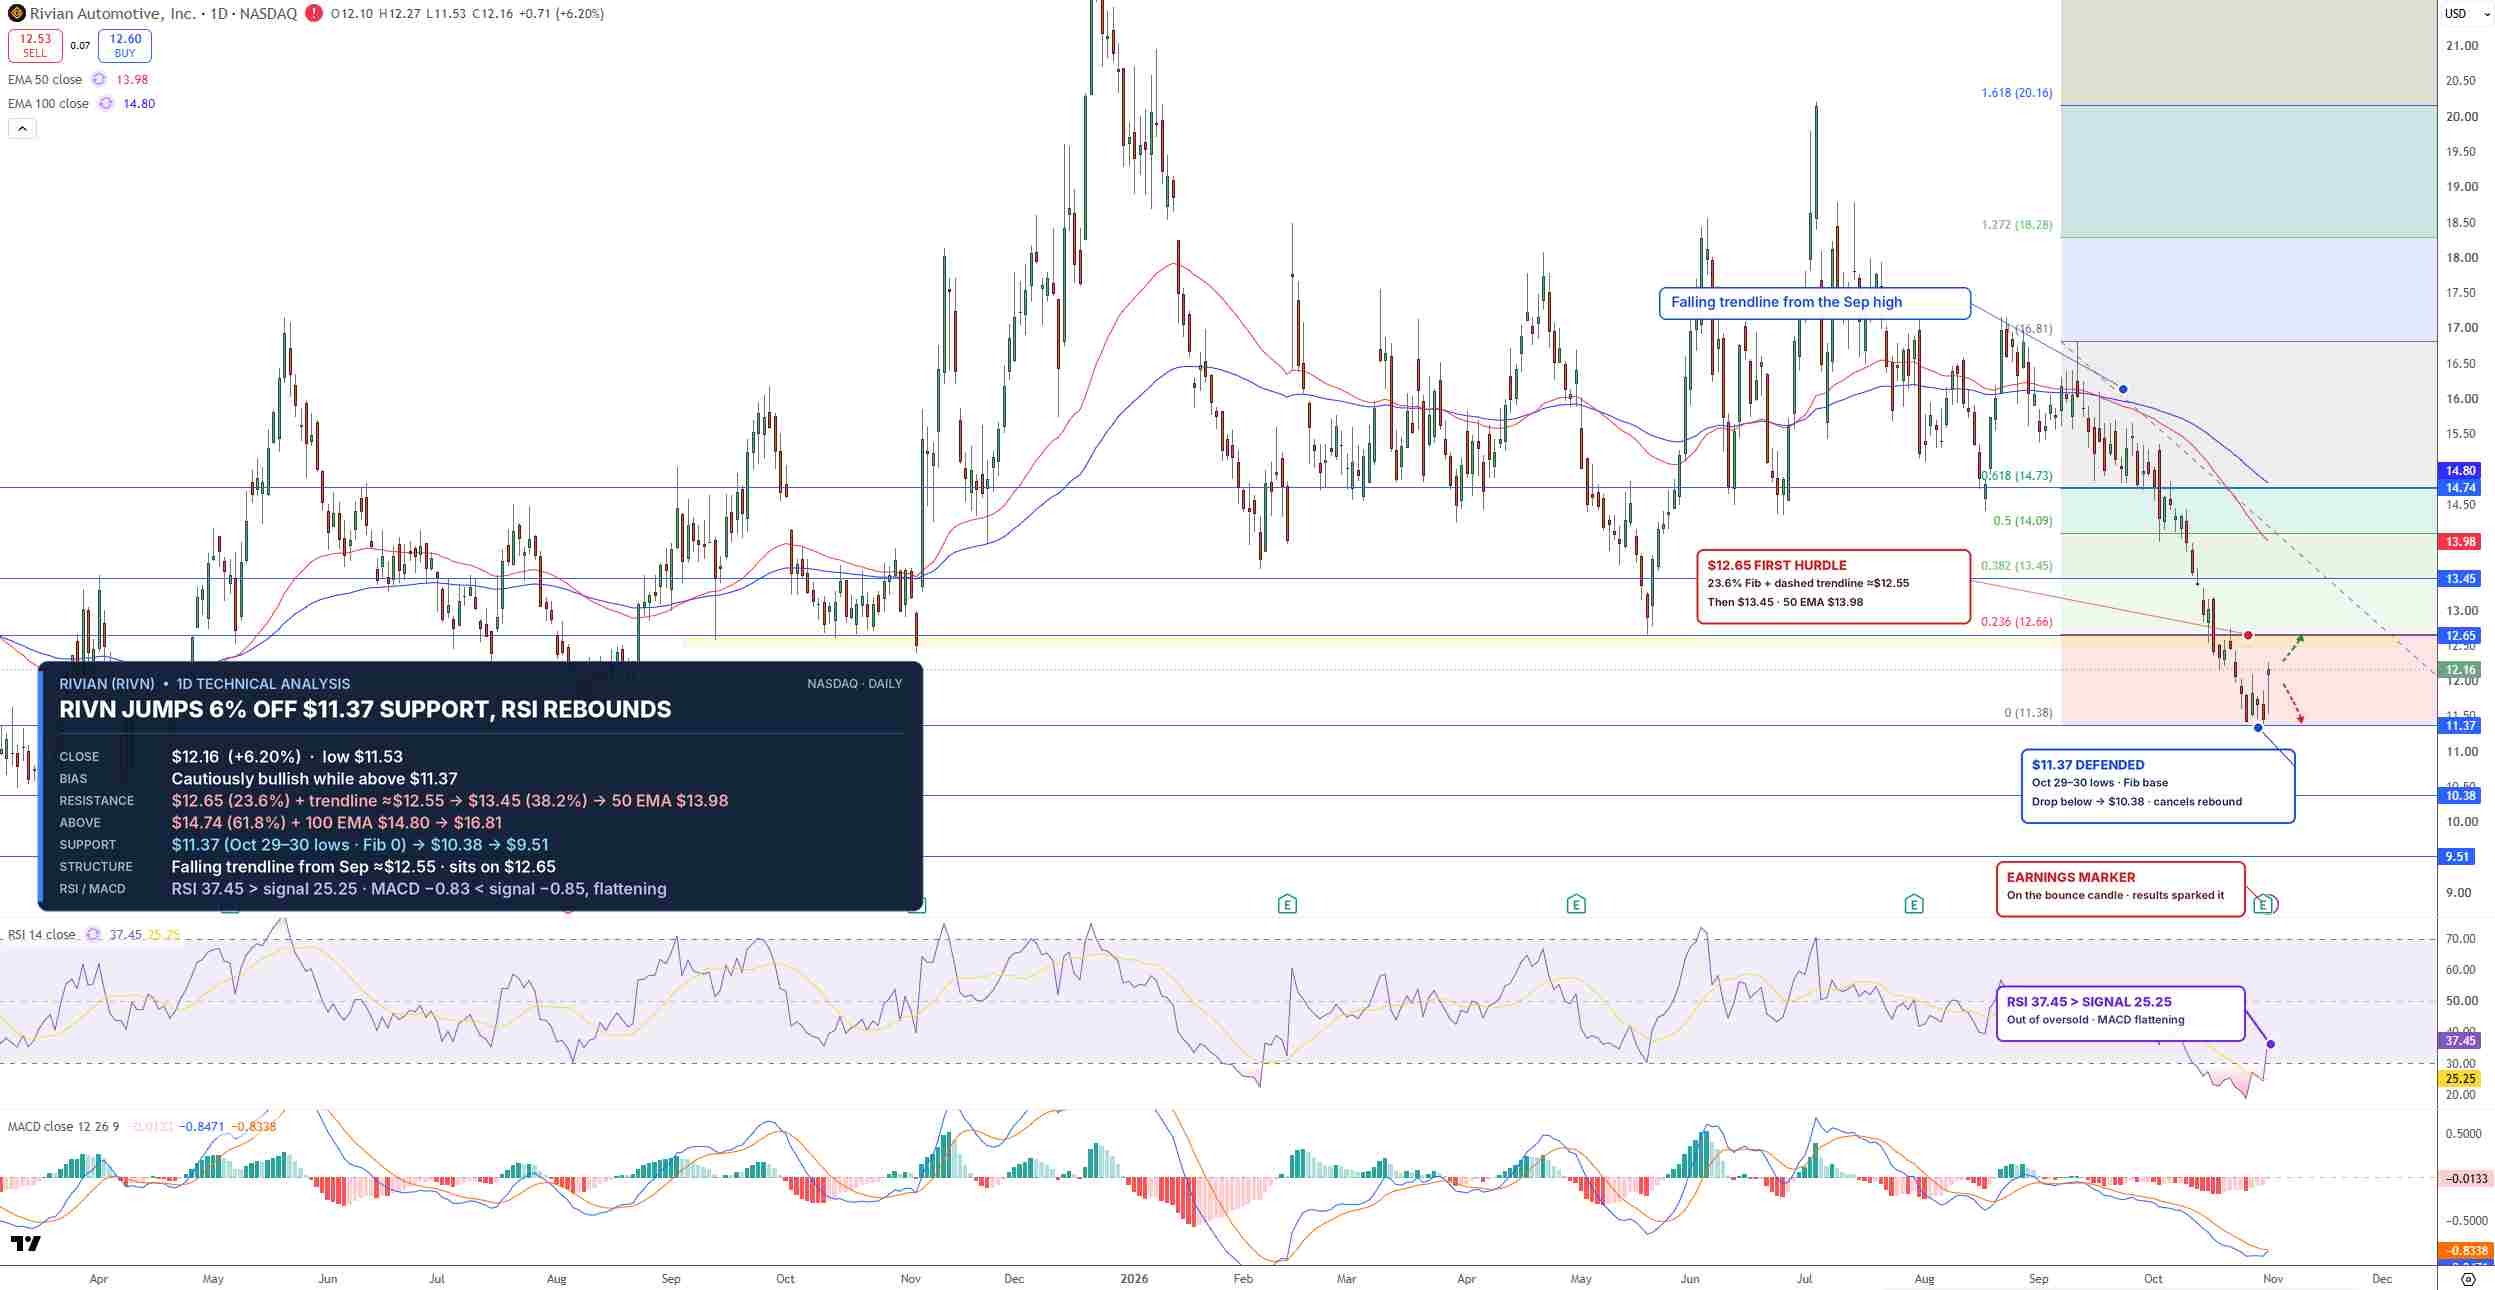
RIVN Price Chart - Source: Tradingview
The first hurdle is $12.65, near the 23.6% Fibonacci retracement, the first Fibonacci level of the recent decline, where a bounce often meets selling. A daily close above it could open $13.45, followed by the 50-day EMA at $13.98. On the downside, a drop below $11.37 would cancel the rebound and could send RIVN toward $10.38.
I'm cautiously bullish in the short term while RIVN holds $11.37, with targets at $12.65 and $13.45.
Key Levels
- Last close: $12.16, up 6.20% on October 30
- Support: $11.37, $10.38
- Resistance: $12.65, $13.45, $13.98, $14.80
- RSI: 37.45, rising from oversold
- Bullish trigger: Daily close above $12.65
- Bearish trigger: Daily close below $11.37
FAQs
Why did Rivian stock rise after earnings?
Rivian beat estimates with revenue up 38% to $2.16 billion and an adjusted loss of $0.48 a share, raised its 2026 delivery guidance to 67,000 to 70,000 vehicles, and said the R2 was its best-selling model. Jefferies also upgraded the stock to Buy.
What is the Rivian stock forecast now?
The short-term bias is cautiously bullish above $11.37 on the daily chart. A daily close above $12.65 targets $13.45 and $13.98, while a drop below $11.37 opens $10.38.
Bottom Line
Rivian's quarter showed real progress, and the stock rose on a day the wider market fell, but cash burn worsened and the car business still loses money. The level that matters is $11.37. In my view, holding it keeps the rebound alive toward $12.65 and $13.45, while a break below it would put $10.38 in play.
Recommended Articles


