


The S&P 500 Is Approaching a Valuation Not Seen Since the Peak of the Dot-Com Bubble, and History Suggests a Crash Could Follow
Key Points
The S&P 500's valuation is approaching a historic level, leaving it vulnerable to a sharp sell-off.
Geopolitical conflicts, rising interest rates, and turbulence in the artificial intelligence industry could derail the current bull market.
History is very clear about what investors should do if the stock market crashes.
- 10 stocks we like better than S&P 500 Index ›
The S&P 500 (SNPINDEX: ^GSPC) index has more than doubled from its 2022 bear market low point, driven by blistering returns from the technology sector which is home to many of the companies leading the artificial intelligence (AI) revolution.
The index's Shiller cyclically adjusted price-to-earnings (CAPE) ratio recently hit 41, a stone's throw away from its all-time high of 44.2 from the peak of the dot-com internet bubble in the year 2000. The CAPE ratio is calculated using the average earnings of the companies in the index over a 10-year period, adjusted for inflation, so it's a highly useful valuation metric.
Missed Nvidia in 2009? This Rare Signal Is Flashing Again. In 2009, a "Double Down" signal flashed for a little-known chipmaker called Nvidia. For the first time in years, that same "Total Conviction" signal is flashing for a company 1/100th the size of Nvidia. Continue »
The S&P 500 plummeted by 49% when the dot-com bubble eventually burst, and although I'm not predicting a similar decline this time around, the mounting risks to the current bull market are getting harder to ignore. Here's what I think investors should do.

Image source: Getty Images.
Rising interest rates and an AI slowdown could crash the S&P 500
There is never a perfect time to invest. War, changes in interest rates, elections, and even new technologies can create uncertainty, and at least one of them is a factor basically all the time. However, several of them are actively fueling volatility in the stock market right now, making this environment especially difficult for investors to navigate.
The U.S. and Iran have been locked in a geopolitical conflict since late February, resulting in the closure of the Strait of Hormuz waterway, through which 25% of the world's seaborne oil travels each day. To make matters worse, the ongoing war between Saudi Arabia and Yemen recently took a turn for the worse, while Ukraine and Russia are actively targeting one another's energy infrastructure in their ongoing conflict.
These tensions are wreaking havoc in the energy markets by disrupting the supply of oil and refined products like diesel. In fact, West Texas Intermediate crude oil was trading for over $103 per barrel last Friday, a whopping 80% increase from its 2026 opening price of $57. Since oil is a massive input cost for practically every product that travels by truck, boat, or plane, American consumers are seeing price hikes almost everywhere, from the grocery store to their favorite retailers.
As a result, the Consumer Price Index (CPI) measure of inflation rose at an annualized rate of 3.7% in September, significantly above the Federal Reserve's 2% target, with the energy component soaring by 20.4%. This prompted the Fed to raise interest rates by 25 basis points last month, and more hikes will almost certainly follow if inflationary pressures persist.
Rising interest rates are often bad for stocks because they force consumers and businesses to tighten their belts, thus putting the brakes on the economy. Weaker corporate earnings can be a direct consequence of any slowdown in economic activity, and earnings drive stock prices over the long term. That's one of the reasons why the S&P 500 suffered a bear-market decline of over 20% during the Fed's last rate hiking cycle, which spanned from March 2022 to August 2023.
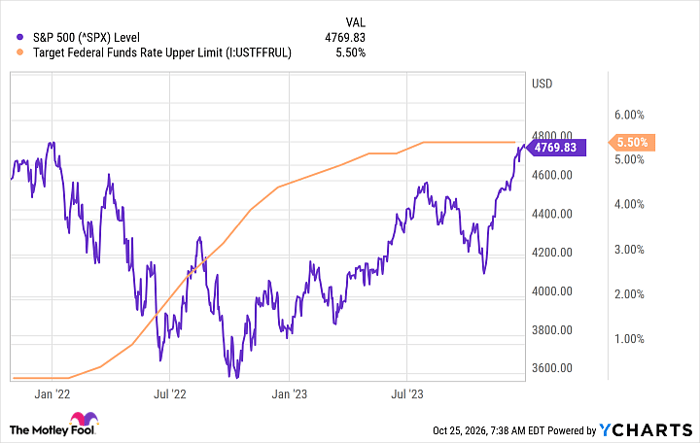
^SPX data by YCharts
Rising interest rates are also threatening the AI infrastructure boom, as neocloud companies like CoreWeave face soaring borrowing costs. Equity investors are now heading for the exits, sending CoreWeave stock plummeting by over 70% from its peak. But it's one of many casualties; earlier this month, Australian data center company, Firmus, had to cancel its blockbuster initial public offering (IPO) due to a lack of demand from investors, which sent a shockwave through the industry.
Recent reports suggest AI giants like Anthropic and OpenAI are also having their valuations slashed by investors. Anthropic, specifically, could face a whopping $500 billion haircut from its $2 trillion expected valuation at its upcoming IPO. These jitters are spreading to the public markets, with the iShares Semiconductor ETF already down 27% from its peak. It holds many of the chip stocks at the heart of the AI data center boom, including Nvidia and Micron Technology.
Here's what investors should do if the stock market plunges
The S&P 500 was only down 2.5% from its peak as of the market close last Friday, but growing headwinds and a rich valuation don't go well together, so I think further downside is ahead.
However, it's important to remember that volatility is a normal part of the investing journey. According to Capital Group, the S&P 500 suffers a decline of 10% or more every 18 months, on average. Bear-market declines of 20% tend to come around every six years, and we are already four years removed from the last bear market in 2022.
Here's the good news: The S&P 500 has delivered a compound annual return of 10.7% since it was established in 1957, even after factoring in every sell-off, correction, and bear market along the way. That means staying invested during periods of uncertainty is critical -- in fact, buying stocks during the scariest moments has been a winning strategy over the last seven decades.
Should you buy stock in S&P 500 Index right now?
Before you buy stock in S&P 500 Index, consider this:
The Motley Fool Stock Advisor analyst team just identified what they believe are the 10 best stocks for investors to buy now… and S&P 500 Index wasn’t one of them. The 10 stocks that made the cut could produce monster returns in the coming years.
Consider when Netflix made this list on December 17, 2004... if you invested $1,000 at the time of our recommendation, you’d have $337,166!* Or when Nvidia made this list on April 15, 2005... if you invested $1,000 at the time of our recommendation, you’d have $1,339,143!*
Now, it’s worth noting Stock Advisor’s total average return is 904% — a market-crushing outperformance compared to 213% for the S&P 500. Don't miss the latest top 10 list, available with Stock Advisor, and join an investing community built by individual investors for individual investors.
See the 10 stocks »
*Stock Advisor returns as of October 28, 2026.
Anthony Di Pizio has no position in any of the stocks mentioned. The Motley Fool has positions in and recommends Micron Technology, Nvidia, and iShares Trust-iShares Semiconductor ETF. The Motley Fool has a disclosure policy.
Recommended Articles


