


80 Years of History Warn What a September Rate Hike Could Mean for Stocks
Key Points
Schwab research on Fed rate hikes since 1946 shows that faster-paced rate hikes hurt stock prices more.
Even with rate hikes, the S&P 500 has delivered 10% average annual returns since 1928.
An investment in the S&P 500 right before the last rate hike cycle in 2022 would have gained 61% since then.
- 10 stocks we like better than Vanguard S&P 500 ETF ›
As of this writing, bond investors expect the Federal Reserve to raise interest rates at its next meeting on Sept. 16. Stubborn inflation and strong job growth in August suggest that the Fed will hike interest rates in September.
A classic rule of thumb in investing is that higher interest rates tend to be bad news for stock prices. When investors can earn higher income on bonds, they might be incentivized to move money out of stocks. Does that mean you should sell stocks in case of a September rate hike?
Missed AI’s "Act 1"? Act 2 Could Be 15x Bigger. Most investors think they missed the AI boat because they didn't buy Nvidia in 2005. But according to our analysts, we’re only at the end of "Act 1"—the R&D phase. "Act 2" is the global rollout. Continue »
Not necessarily. Charles Schwab recently published research based on nearly 80 years of data about how Fed interest rate hikes affect stock prices. The story is more complex than "stocks always go down after rate hikes."
Let's look at what 80 years of history can show us about rate hikes and stocks -- and what long-term investors should do next.
Image source: Getty Images.
Fed rate hikes tend to lead to stock price declines -- but the market bounces back
Charles Schwab researchers looked at data going back to 1946 to see what happens to stock prices after Fed rate hikes. The research found that the S&P 500 index (SNPINDEX: ^GSPC) historically experienced maximum drawdowns averaging -12% within the first six months of the Fed's first rate hike, and -14% within the first 12 months.
But not every Fed rate hike is the same. It matters how fast the Fed raises rates. The Schwab research also found that when the Fed tightens rates faster, the S&P 500 had an average maximum drawdown of -16% in the first 12 months.
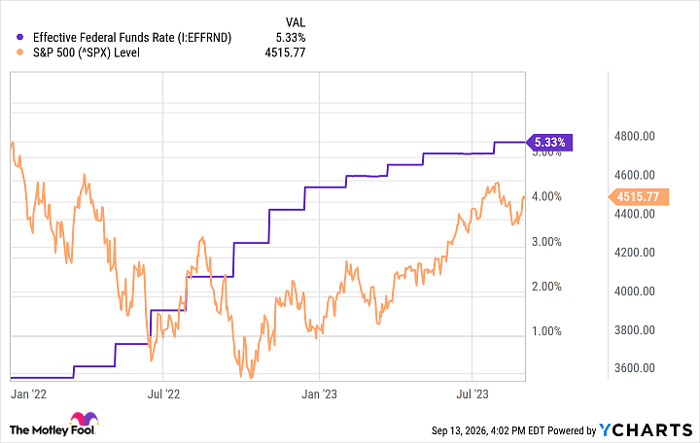
Investors saw this kind of severe drawdown in 2022-2023, when the Fed fought high inflation by rapidly hiking interest rates. As interest rates rose quickly from near zero in January 2022 to 5.33% in summer 2023, the S&P 500 went into a bear market.
Effective Federal Funds Rate data by YCharts
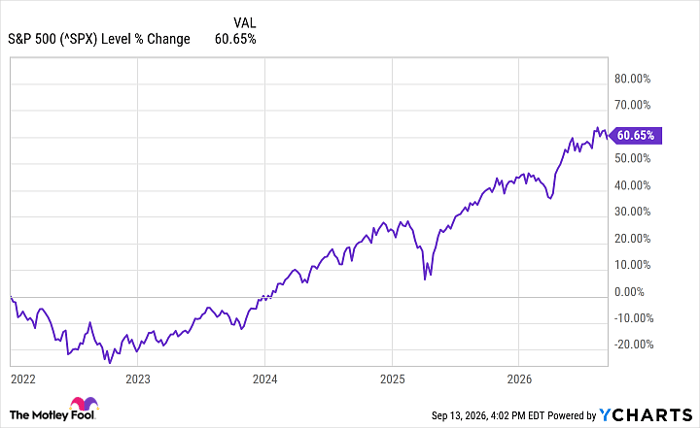
Here's the good news for stock market investors: Even after a big drawdown, the market tends to bounce back fast. For example, if you had invested in the S&P 500 on Jan. 1, 2022, right before that bad year for stocks, your investment would be up almost 61% today.
^SPX data by YCharts
Keep in mind that over the very long run, ever since 1928, the S&P 500 has delivered average annual returns of about 10%. That includes economic crises, global conflicts, and times of rapidly rising interest rates. The Vanguard S&P 500 ETF (NYSEMKT: VOO) is one of the most popular exchange-traded funds that lets you own the entire S&P 500. In the past five years, this fund has delivered average annual returns of 12.75%.
How to invest during Fed rate hikes
No one knows what's going to happen next with the economy, the job market, inflation, and other factors that influence the Fed's decisions. It's possible that this likely September rate hike will be a one-time increase, not the start of a longer, faster, more aggressive cycle of Fed rate increases. If Kevin Warsh's Fed raises rates more slowly than what happened in 2022, stock market prices might not go through such a big downturn.
But no matter what happens next with the Fed, most long-term investors should keep buying stocks according to their overall financial plan. Try not to overreact to short-term moves in interest rates. If you can leave your money invested for the next five to 10 years (or more), today's news about rate hikes likely won't mean much in the long run.
Should you buy stock in Vanguard S&P 500 ETF right now?
Before you buy stock in Vanguard S&P 500 ETF, consider this:
The Motley Fool Stock Advisor analyst team just identified what they believe are the 10 best stocks for investors to buy now… and Vanguard S&P 500 ETF wasn’t one of them. The 10 stocks that made the cut could produce monster returns in the coming years.
Consider when Netflix made this list on December 17, 2004... if you invested $1,000 at the time of our recommendation, you’d have $417,413!* Or when Nvidia made this list on April 15, 2005... if you invested $1,000 at the time of our recommendation, you’d have $1,341,294!*
Now, it’s worth noting Stock Advisor’s total average return is 950% — a market-crushing outperformance compared to 212% for the S&P 500. Don't miss the latest top 10 list, available with Stock Advisor, and join an investing community built by individual investors for individual investors.
See the 10 stocks »
*Stock Advisor returns as of September 15, 2026.
Charles Schwab is an advertising partner of Motley Fool Money. Ben Gran has no position in any of the stocks mentioned. The Motley Fool has positions in and recommends Vanguard S&P 500 ETF. The Motley Fool recommends Charles Schwab and recommends the following options: short September 2026 $95 calls on Charles Schwab. The Motley Fool has a disclosure policy.
Recommended Articles


