

If You'd Invested $5,000 in the S&P 500 at the Great Recession Bottom, Here's What You'd Have Today

Source The Motley Fool

Key Points

  • During the financial crisis, the S&P 500 hit its low in March 2009.

  • Despite cratering sentiment at the time, it turned out to be one of the best buying opportunities in decades.

  • Here's the staggering return S&P 500 investors would have earned by buying at the low point.

  • 10 stocks we like better than S&P 500 Index ›

At the lowest point of the financial crisis in the late 2000s, it felt like the U.S. economy might literally fall apart. The economy was in the midst of a deep recession. The housing market was collapsing. The unemployment rate briefly topped 10%.

To say the least, it sure didn't feel like the best time to be buying stocks.

Missed Nvidia in 2009? This Rare Signal Is Flashing Again. In 2009, a "Double Down" signal flashed for a little-known chipmaker called Nvidia. For the first time in years, that same "Total Conviction" signal is flashing for a company 1/100th the size of Nvidia. Continue »

At its lowest point on March 9, 2009, the S&P 500 (SNPINDEX: ^GSPC) closed at 676.53. The index wouldn't hit a new all-time high again until 2012.

But in hindsight, it turned out to be one of the best buying opportunities ever.
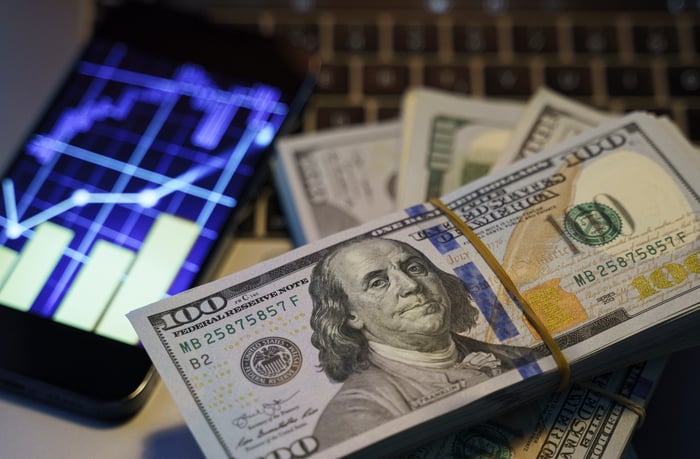
Stacks of dollar bills sitting next to a smartphone and computer keyboard.

Image source: Getty Images.

As of Sept. 10, the S&P 500 closed at 7,591.70. If you had bought the index at the March 2009 market low, your investment would have gained a staggering 1,030%. Add in reinvested dividends and the total return climbs to 1,470%!

Based on this, a $5,000 investment made at the Great Recession low would be worth around $56,690. With reinvested dividends, the account balance would be $78,510.

These numbers prove that bear markets and once-in-a-generation catastrophes are unquestionably painful to experience. But they can also be generational buying opportunities if you have the stomach to take advantage of them.

Nobody knows when a market bottom may occur. The biggest takeaway from this example is that if you have a long-term time horizon and don't need the money for years or even decades, continuing to invest in the S&P 500 as part of a systematic and consistent plan is usually the best course of action.

Even when conditions look historically bleak, there's always an opportunity hiding in the darkness.

Should you buy stock in S&P 500 Index right now?

Before you buy stock in S&P 500 Index, consider this:

The Motley Fool Stock Advisor analyst team just identified what they believe are the 10 best stocks for investors to buy now… and S&P 500 Index wasn’t one of them. The 10 stocks that made the cut could produce monster returns in the coming years.

Consider when Netflix made this list on December 17, 2004... if you invested $1,000 at the time of our recommendation, you’d have $417,413!* Or when Nvidia made this list on April 15, 2005... if you invested $1,000 at the time of our recommendation, you’d have $1,341,294!*

Now, it’s worth noting Stock Advisor’s total average return is 950% — a market-crushing outperformance compared to 212% for the S&P 500. Don't miss the latest top 10 list, available with Stock Advisor, and join an investing community built by individual investors for individual investors.

See the 10 stocks »

*Stock Advisor returns as of September 14, 2026.

David Dierking has no position in any of the stocks mentioned. The Motley Fool has no position in any of the stocks mentioned. The Motley Fool has a disclosure policy.

Disclaimer: For information purposes only. Past performance is not indicative of future results.
placeholder
Japanese Yen rallies to February 18 high as upbeat wage data and GDP lift BoJ hike betsThe USD/JPY pair declines for the second straight day – also marking the fourth day of a fall in the previous five – and sinks to its lowest level since February 18, around mid-153.00s during the Asian session on Tuesday.
Author  FXStreet
Sep 08, Tue
The USD/JPY pair declines for the second straight day – also marking the fourth day of a fall in the previous five – and sinks to its lowest level since February 18, around mid-153.00s during the Asian session on Tuesday.
placeholder
Brent holds above $100 as tanker attacks tighten supply — but four forces are capping the rallyBrent crude is holding above $100 a barrel for a second session, its first close above the level since late July, as tanker attacks near the Strait of Hormuz squeeze an already tight physical market. Yet the rally has been gradual: 8.3 mb/d of Gulf output is still shut in, diesel is at a record, and forecasts now range from $74 to $100.
Author  Irene Q.
Sep 10, Thu
Brent crude is holding above $100 a barrel for a second session, its first close above the level since late July, as tanker attacks near the Strait of Hormuz squeeze an already tight physical market. Yet the rally has been gradual: 8.3 mb/d of Gulf output is still shut in, diesel is at a record, and forecasts now range from $74 to $100.
placeholder
US August CPI lands tonight: after a 5.4% PPI shock, will the Fed hike on September 16?US August PPI came in at 5.4% year-on-year, above the 5.3% consensus, with core PPI at 4.6%. Traders have pushed the odds of a 25bp Fed hike on September 15-16 to around 70%. Tonight's CPI is the last major inflation print before the decision — here is the full calendar, the consensus numbers, and what a hot versus cool reading would mean for the dollar, yields, gold and stocks.
Author  Irene Q.
Sep 11, Fri
US August PPI came in at 5.4% year-on-year, above the 5.3% consensus, with core PPI at 4.6%. Traders have pushed the odds of a 25bp Fed hike on September 15-16 to around 70%. Tonight's CPI is the last major inflation print before the decision — here is the full calendar, the consensus numbers, and what a hot versus cool reading would mean for the dollar, yields, gold and stocks.
placeholder
Gold Price Forecast: PPI and Oil Prices Fuel Inflation Concerns, Can CPI Change Gold's Direction?As of the Asian session on September 11, gold prices (XAUUSD) remained in weak consolidation today after dropping sharply to near $4,300 on Thursday, with the latest price trading around
Author  TradingKey
Sep 11, Fri
As of the Asian session on September 11, gold prices (XAUUSD) remained in weak consolidation today after dropping sharply to near $4,300 on Thursday, with the latest price trading around
placeholder
Fed hike odds near 90% into Wednesday's decision — how to trade the dollar, gold and the S&P 500A 0.3% monthly core CPI print has lifted the market-implied probability of a 25bp Fed hike on 16 September to roughly 86.5% ~ 90%, which would be the first increase since July 2023. Here is the decision timeline, the pricing versus the forecasts, both scenarios, and the key levels for the dollar, gold and the S&P 500.
Author  Suzie
5 hours ago
A 0.3% monthly core CPI print has lifted the market-implied probability of a 25bp Fed hike on 16 September to roughly 86.5% ~ 90%, which would be the first increase since July 2023. Here is the decision timeline, the pricing versus the forecasts, both scenarios, and the key levels for the dollar, gold and the S&P 500.
goTop
quote