


Heed Warren Buffett's Advice: The Time to Be Fearful When Others Are Greedy Has Arrived on Wall Street
Key Points
Although the Oracle of Omaha retired as Berkshire Hathaway’s CEO on Dec. 31, his nuggets of investing wisdom live on.
Buffett’s favorite valuation tool recently made dubious history.
However, Berkshire’s now-former boss would never bet against America and has used inevitable stock market downturns as opportunities to pounce on amazing deals.
- 10 stocks we like better than S&P 500 Index ›
On Dec. 31, billionaire Warren Buffett retired as Berkshire Hathaway's (NYSE:BRKA)(NYSE:BRKB) CEO, handing the keys to the trillion-dollar conglomerate he helped build to Greg Abel. After more than half a century at the helm, the Oracle of Omaha outperformed the benchmark S&P 500 (SNPINDEX:^GSPC) by more than 6,000,000!
But even though Berkshire's boss is no longer overseeing the company's day-to-day operations or its $358 billion investment portfolio, his nuggets of wisdom via annual letters and annual shareholder meetings live on.
Missed Nvidia in 2009? This Rare Signal Is Flashing Again. In 2009, a "Double Down" signal flashed for a little-known chipmaker called Nvidia. For the first time in years, that same "Total Conviction" signal is flashing for a company 1/100th the size of Nvidia. Continue »

The Oracle of Omaha has always been a stickler for value. Image source: The Motley Fool.
Arguably, no Buffett-ism is more profound than a single statement in his 1986 letter to shareholders:
Our goal is modest: we simply attempt to be fearful when others are greedy and to be greedy when others are fearful.
Make no mistake about it: based on Warren Buffett's definition, the time to be fearful when others are greedy has arrived on Wall Street.
Stock valuations and casino culture are raising red flags
Although the Oracle of Omaha has never been a top-caller and favors long-term investing, it doesn't mean he's agnostic to stock valuations. He bent or broke several of his unwritten investing rules over multiple decades, with one exception: he never purchased shares of a company that he didn't believe offered value.
Warren Buffett was a stickler for value, and today's stock market offers very few bargains.
In a 2001 interview with Fortune magazine, Buffett referred to the market-cap-to-GDP ratio as "probably the best single measure of where valuations stand at any given moment." This ratio, which adds up the total value of all U.S. public companies and divides it into annualized U.S. gross domestic product (GDP), has become known as the Buffett indicator.
Stock Market reaches most expensive valuation in history after the Warren Buffett Indicator hits 239%, surpassing the Dot Com Bubble, the Global Financial Crisis, and the 2022 Bear Market 🤯 👀 pic.twitter.com/K5LBAN6S2Q
— Barchart (@Barchart) August 15, 2026
When backtested to December 1970, the Buffett indicator has averaged 88%. In other words, the aggregate value of U.S. stocks has, on average, equaled 88% of U.S. GDP. In mid-August, the Buffett indicator screamed to a fresh all-time high above 240%!
Valuations aren't the only issue, either. Outstanding margin debt skyrocketed to a record high of $1.502 trillion in June 2026, signaling increased risk-taking by investors. While it's perfectly normal for margin debt (the amount investors borrow from their broker, with interest) to rise over the long run in lockstep with the overall value of public companies, parabolic increases in outstanding margin debt have been a glaring red flag for decades.
Berkshire's now-former boss has become wary of casino culture on Wall Street and the emphasis of some individuals on trying to time the market or make a quick buck.
Collectively, stock valuations and rapidly rising margin debt signal a heightened probability of outsize volatility and eventual downside for equities. There's a reason Warren Buffett was a net-seller of equities for 13 consecutive quarters leading up to his retirement as Berkshire's CEO.

Image source: Getty Images.
Don't forget to be greedy when Wall Street's greed shifts to fear
At the same time, inevitable stock market corrections, bear markets, and short-lived crash events provide the ideal opportunity for patient investors to pounce. Historically, playing the contrarian when everyone else is fearful works out well for investors.
For example, the analysts at Crestmont Research refresh a data set annually that calculates the rolling 20-year total returns, including dividends, of the benchmark S&P 500 since 1900. Even though the S&P wasn't officially incepted until 1923, the performance of its components was tracked in other major indexes back to the turn of the century.
Crestmont Research found that all 107 rolling 20-year periods it examined (1900-1919, 1901-1920, and so on through 2006-2025) generated a positive annualized total return.
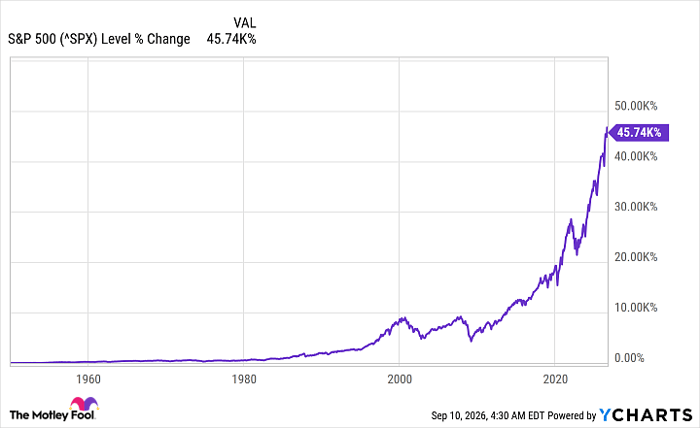
^SPX data by YCharts
In simpler terms, if an investor had, hypothetically (since index funds only began trading in the U.S. in 1993), purchased an S&P 500 index fund at any point between 1900 and 2006 and held it for 20 years, they would have profited every time. This means buying near the dot-com bubble top was still profitable for long-term-minded investors who allowed time and corporate earnings growth to work their magic.
The stock market and U.S. economy are highly resilient, and Warren Buffett has repeatedly stated that he wouldn't bet against America.
When stock valuations eventually return from orbit, amazing deals can be had for those greedy enough to pounce on them.
Should you buy stock in S&P 500 Index right now?
Before you buy stock in S&P 500 Index, consider this:
The Motley Fool Stock Advisor analyst team just identified what they believe are the 10 best stocks for investors to buy now… and S&P 500 Index wasn’t one of them. The 10 stocks that made the cut could produce monster returns in the coming years.
Consider when Netflix made this list on December 17, 2004... if you invested $1,000 at the time of our recommendation, you’d have $417,413!* Or when Nvidia made this list on April 15, 2005... if you invested $1,000 at the time of our recommendation, you’d have $1,341,294!*
Now, it’s worth noting Stock Advisor’s total average return is 950% — a market-crushing outperformance compared to 212% for the S&P 500. Don't miss the latest top 10 list, available with Stock Advisor, and join an investing community built by individual investors for individual investors.
See the 10 stocks »
*Stock Advisor returns as of September 14, 2026.
Sean Williams has no position in any of the stocks mentioned. The Motley Fool has positions in and recommends Berkshire Hathaway. The Motley Fool has a disclosure policy.
Recommended Articles


