


If You Invest When the Market Reaches Its Peak, How Will Your Investment Turn Out? History Offers an Answer That Might Surprise You.
Key Points
The S&P 500 has climbed nearly 100% over the past three and a half years.
Recent headwinds have prompted investors to wonder whether the gains will continue.
- 10 stocks we like better than S&P 500 Index ›
The S&P 500 roared higher over the past three calendar years, and this year the index has kept up the positive momentum. From the last trading day of 2022 through today, the famous benchmark has advanced about 97%. The index has reached multiple record highs over the period and is trading near a high at the moment.
All of that has been fantastic for investors, but at the same time, various headwinds have intensified. Inflation is on the rise, prompting investors to worry about consumer spending and companies' financial outlooks. Meanwhile, tech giants are spending billions of dollars on artificial intelligence (AI) infrastructure, which has already supercharged revenue -- but some investors have questioned whether the future revenue opportunity will justify this level of spending.
Missed Nvidia in 2009? This Rare Signal Is Flashing Again. In 2009, a "Double Down" signal flashed for a little-known chipmaker called Nvidia. For the first time in years, that same "Total Conviction" signal is flashing for a company 1/100th the size of Nvidia. Continue »
Against this backdrop, the question is whether the market has reached its peak or will do so in the near future. And if you invest at such a time, how will your investment turn out? History offers an answer that might surprise you.

Image source: Getty Images.
What's driving the bull market
So first, let's zoom in for a closer look at the S&P 500 and what's been driving this bull market. As mentioned, AI has been a key part of this picture. Companies designing essential AI products or making available AI services -- such as chip designer Nvidia and cloud services leader Amazon -- have already scored an earnings win. And since these companies are heavily weighted in the S&P 500, they've helped push the index higher.
Considering the favorable economic landscape, with interest rate cuts in recent years, investors turned to other growth stocks as well. This year, however, the picture has changed, with energy prices rising and overall inflation climbing too. Investors have turned away from some growth players — including AI stocks — and piled into other sectors, from healthcare to consumer staples companies, as "safer" bets in a more difficult economy.
The S&P 500 hasn't tumbled, however. It's gone through its share of dips here and there amid the concerns I've mentioned above, but it remains very close to its record high level, reached just weeks ago. And the S&P 500 Shiller CAPE ratio, an inflation-adjusted look at valuation, shows us that stocks were only more expensive than today one time before -- during the dot-com bubble.
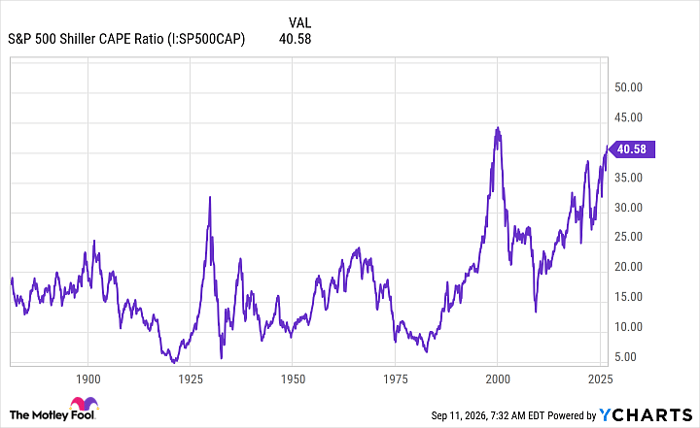
S&P 500 Shiller CAPE Ratio data by YCharts
Is a market peak here or on the horizon?
So it's not surprising that some investors are wondering whether the S&P 500 has reached or will soon reach a peak, suggesting that declines may follow. And that may prompt them to hold off on buying stocks. But is that really the right decision? Now, let's turn to our question. What does history tell us about buying stocks at a peak?
Let's imagine that you invested on the following dates:
- March 24, 2000, before the tech bubble burst
- Oct. 9, 2007, before the global financial crisis
- Feb. 19, 2020, ahead of the coronavirus market crash
According to a report by BlackRock's iShares, your returns would have been as follows:
- After the 2000 investment, you would have been down 5% after 10 years, but after 20 years, you would have posted a 141% gain.
- After the 2007 investment, you would have gained 109% after 10 years.
- And after the 2020 purchase, you would have posted a 25% increase in the following year.
So the answer is surprising: Buying at the high hasn't resulted in losses for investors, particularly over the long term. The good news here is you don't have the daunting job of timing the market and looking for the lowest entry point.
Instead, in any market environment, you can prepare yourself for investing success by seeking out quality companies trading at reasonable valuations -- if valuation falls further after your purchase, that's OK. As history has clearly demonstrated, even if you buy at the absolutely worst moment, it probably won't matter. In investing, time is on your side, and that's fantastic news for long-term investors.
Should you buy stock in S&P 500 Index right now?
Before you buy stock in S&P 500 Index, consider this:
The Motley Fool Stock Advisor analyst team just identified what they believe are the 10 best stocks for investors to buy now… and S&P 500 Index wasn’t one of them. The 10 stocks that made the cut could produce monster returns in the coming years.
Consider when Netflix made this list on December 17, 2004... if you invested $1,000 at the time of our recommendation, you’d have $417,413!* Or when Nvidia made this list on April 15, 2005... if you invested $1,000 at the time of our recommendation, you’d have $1,341,294!*
Now, it’s worth noting Stock Advisor’s total average return is 950% — a market-crushing outperformance compared to 212% for the S&P 500. Don't miss the latest top 10 list, available with Stock Advisor, and join an investing community built by individual investors for individual investors.
See the 10 stocks »
*Stock Advisor returns as of September 14, 2026.
Adria Cimino has positions in Amazon. The Motley Fool has positions in and recommends Amazon and Nvidia. The Motley Fool has a disclosure policy.
Recommended Articles


