


SpaceX Stock Price Forecast: How Much Upside Is Left for SPCX as Shares Return to $150?
TradingKey - After experiencing intense volatility in its early post-listing period, SpaceX (SPCX) shares have reclaimed $150. Since debuting on Nasdaq on June 12, this popular new stock first surged rapidly before pulling back sharply, completing a cycle from frenzy to cooling and then to valuation recovery in just three months.
Following its IPO on June 12, the company's stock opened at $150, above its $135 offer price, and subsequently climbed to a high of $225.64 before dropping to a low of $104.83 in early August. As of September 11, the stock closed at $151.21, up 2.04% for the day, roughly 12% above its offer price, but still down about 33% from its all-time high.
SpaceX Profitability Is Improving, but Valuation Remains the Biggest Pressure
SpaceX currently remains unprofitable, but its revenue is growing rapidly. The company's second-quarter revenue surged 92% year-over-year to $7.8 billion, while its net loss narrowed from about $1 billion in the same period last year to $541 million, or $0.09 per share, coming in narrower than market expectations.
Looking at single-quarter performance, this signals a relatively positive trend, especially considering that part of the first-quarter loss was affected by one-off financial charges. Consequently, the improvement in second-quarter profitability suggests that the operating performance of the company's core business is gradually picking up.
However, looking across the first half of the year, SpaceX's profitability has not yet completely shaken off pressure. In the first half of this year, the company's net loss per share reached $1.12, up from $0.53 in the same period of 2025, as the larger first-quarter loss offset the second-quarter improvement. Therefore, SpaceX still has some way to go before achieving truly stable profitability.
Based on current market expectations, SpaceX's third- and fourth-quarter earnings per share are expected to reach approximately $0.15 and $0.45, respectively, with the full-year 2027 EPS forecast rising further to around $1.75. If this profitability path materializes, the company's fundamentals will undoubtedly be stronger than they are now.
However, the issue is that the stock price has already priced in a significant portion of growth expectations in advance. Based on a valuation of roughly $2 trillion, even assuming the market's projected 2026 revenue of about $44.7 billion, SpaceX's price-to-sales ratio remains well over 40 times. This means investors are not buying a mature, profitable aerospace company, but are paying a very high premium for rapid growth over the next several years.
Therefore, even if SpaceX continues to improve profits in the coming quarters or officially enters the profitable phase, it does not mean the stock price will necessarily continue to rise. Only if actual results consistently beat already elevated market expectations can the valuation expand further.
SpaceX Stock Technical Analysis
Source: TradingView
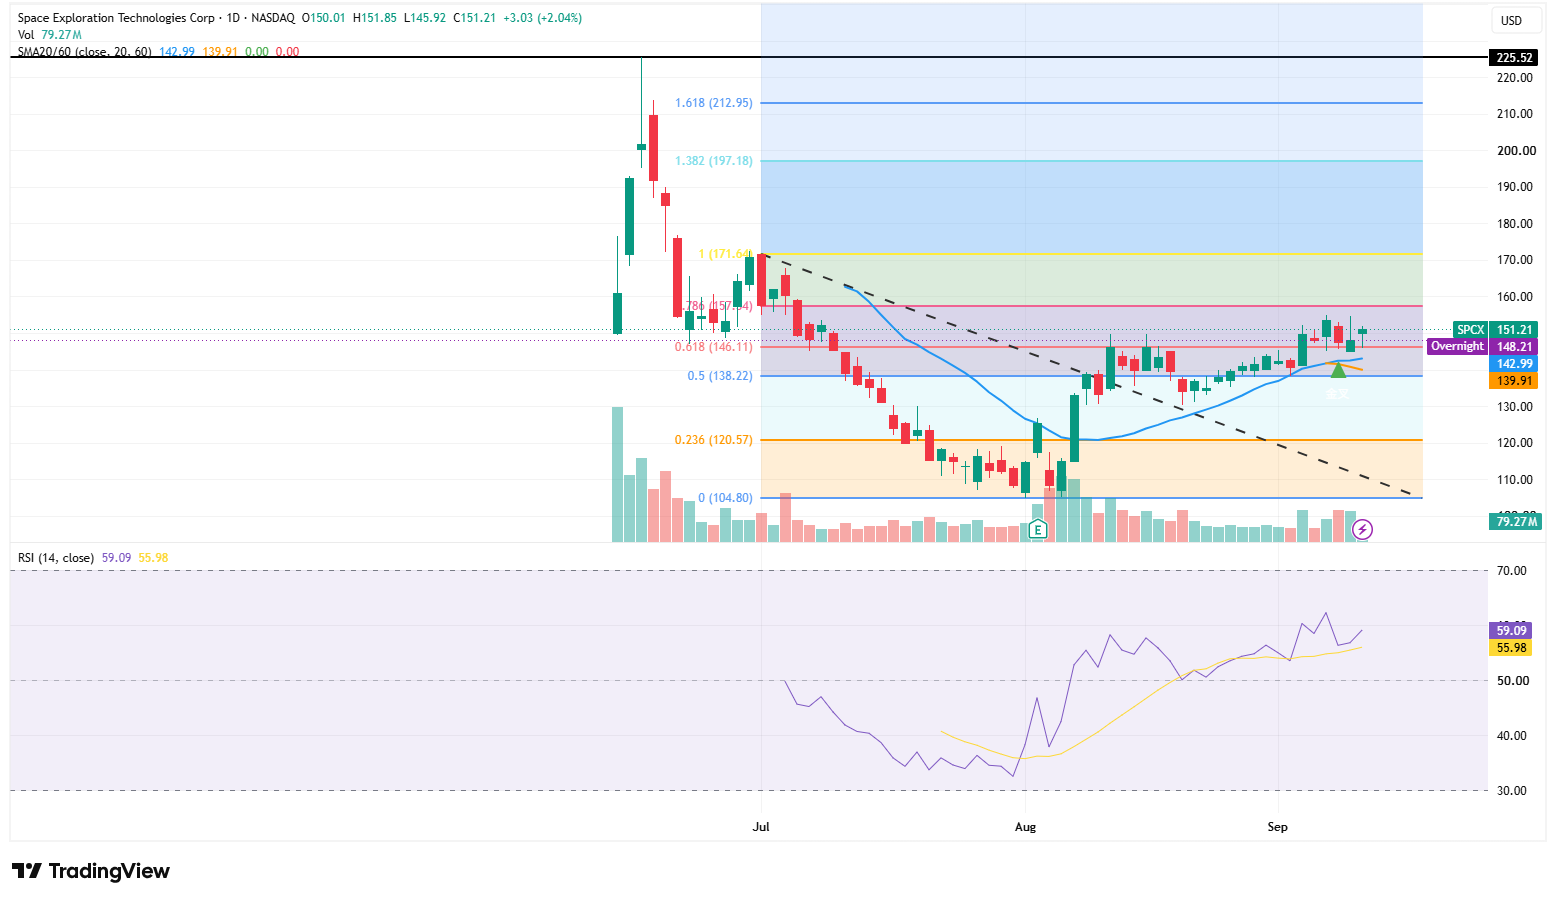
On the daily chart, SPCX rose 2.04% in its latest session, closing at $151.21. The stock has broken through a previously formed downward trendline while reclaiming both its 20-day moving average of $142.99 and 60-day moving average of $139.91. Furthermore, the 20-day moving average crossed above the 60-day moving average to form a golden cross, indicating that the short-term trend has shifted from a weak bounce toward a bullish bias.
On the momentum front, the 14-day RSI rose to 59.09, standing above both its signal line at 55.98 and the 50 neutral mark. This indicates that buying momentum is strengthening while remaining below the overbought threshold of 70, leaving room for further upside. The latest trading volume rose to approximately 79.27 million shares, providing volume support for the rebound.
To the upside, the primary level to watch is the 0.786 Fibonacci level at $157.14. If SPCX can close above $157 on heavy volume, the next target will be $171.64, representing a potential gain of approximately 13.5% from current levels. The $171 to $172 range also marks a previous bounce high, and a breakout would signal that the stock has truly escaped its recent consolidation range.
If SPCX further consolidates above $171.64, subsequent upside targets to watch are $197.18 and $212.95, representing potential gains of about 30% and 41%, respectively. The $225.52 mark is the historical high established shortly after listing, sitting about 49% above the current price and acting as the strongest medium-term resistance level.
To the downside, the initial support lies at $146.11, followed by the 20-day moving average at $143. As long as the stock remains above the $143 to $146 zone, the short-term upward structure remains intact; if it breaks below this area, a retest of $138.22 to $139.91 may occur. If $138 is breached on heavy volume, downside risks could expand further toward $120.57.
Recommended Articles


