


Meet the Magnificent Momentum-Driven ETF Obliterating the S&P 500 in 2026
Key Points
The Vanguard U.S. Momentum Factor ETF invests in stocks showing strong uptrends.
The ETF has outperformed the S&P 500 every year, on average, since it launched in 2018.
The fund provides investors with a way to own a slice of almost 700 winning stocks.
- 10 stocks we like better than Vanguard Wellington Fund - Vanguard U.s. Momentum Factor ETF ›
Top fund managers like Peter Lynch and Paul Tudor Jones often credit their success to letting their winning investments run, while quickly cutting their losers. Lynch says doing the opposite would be equivalent to cutting the flowers and watering the weeds in your garden which, of course, would make no rational sense.
The Vanguard U.S. Momentum Factor ETF (NYSEMKT: VFMO) is an exchange-traded fund (ETF) that exclusively invests in winners. It uses mathematical models to identify stocks that are trending higher, and it places a greater emphasis on those showing sustained returns over the last 12 months of trading.
Missed Nvidia in 2009? This Rare Signal Is Flashing Again. In 2009, a "Double Down" signal flashed for a little-known chipmaker called Nvidia. For the first time in years, that same "Total Conviction" signal is flashing for a company 1/100th the size of Nvidia. Continue »
The ETF has delivered a return of 18.5% so far in 2026 (as of the market close on Thursday, Sept. 10), so it's obliterating the benchmark S&P 500 index which is up 10.9%. That isn't a surprise, though, considering the fund has beaten the market every year on average since it launched in 2018.
Here's why that run of outperformance is likely to continue.

Image source: Getty Images.
Hundreds of winning stocks in one ETF
The mathematical models behind the Vanguard U.S. Momentum Factor ETF select stocks based on their performance over the last 12 months, but they also analyze momentum over the last six months to ensure the upward trend remains intact. The models also run calculations to ensure each stock is rising based on its own fundamentals, and not because the broader market is trending higher.
The ETF was holding 697 stocks from nine different economic sectors as of Sept. 9. These three sectors had the highest weightings:
- Technology: 25.1%
- Healthcare: 20.8%
- Industrials: 19%
Six of the top 10 holdings in the Vanguard ETF are in the technology sector. They include Sandisk, Micron Technology, Dell Technologies, Advanced Micro Devices, Intel, and Applied Materials. Those six stocks have delivered a median return of more than 300% over the last 12 months, crushing the 16% return in the S&P 500, which is precisely why they are among the top positions in this momentum-driven ETF.
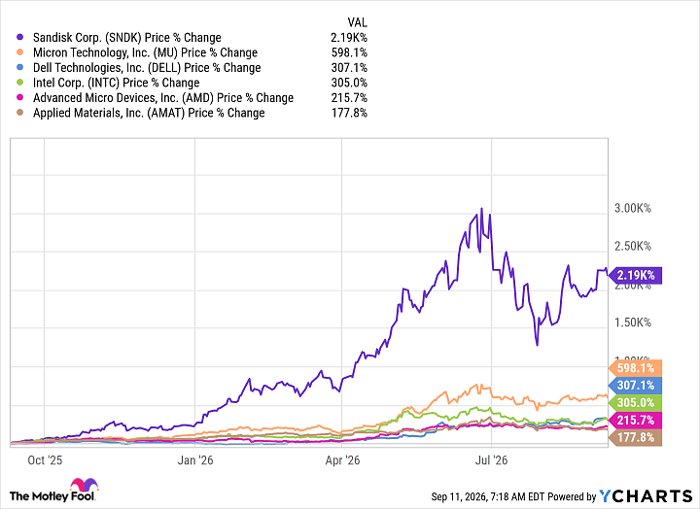
SNDK data by YCharts
But the stocks at the top of this ETF might not be there for long, because it has an extremely high turnover rate of 99.9%. That means the fund can be expected to replace nearly every single holding in its portfolio over the course of a year. It turns out not even the best stocks rise in a straight line over the long term -- regular dips and bouts of volatility are simply part of the journey.
Remarkably, not even Nvidia has consistently held its place in this ETF over the last few years despite its incredible overall return.
History suggests the Vanguard ETF can continue beating the S&P 500
The Vanguard U.S. Momentum Factor ETF has delivered a compound annual return of 14.9% since it launched in 2018, beating the S&P 500 which returned an average of 14.1% per year over the same period.
That means its momentum-driven strategy has worked despite a series of sharp sell-offs triggered by events like the COVID-19 pandemic in 2020, the inflation spike in 2022, and the Trump administration's sweeping tariffs in 2025. Simply put, unceremoniously purging losing stocks from a portfolio while buying those with upward momentum appears to be a winning formula no matter what the broader market is doing.
For that reason, the Vanguard ETF is likely to continue outperforming the S&P 500 over the long term. Even if artificial intelligence and semiconductor stocks suddenly stop leading the market higher, the ETF's mathematical models will quickly rotate its holdings as necessary.
But before buying this Vanguard ETF, investors should consider its cost. It has an expense ratio of 0.13%, translating to an annual fee of $13 for every $10,000 invested. That doesn't sound like much, but it's four-times as expensive as some of Vanguard's index funds, which have expense ratios of just 0.03%. Fortunately, its returns have more than made up for the higher fee so far.
Should you buy stock in Vanguard Wellington Fund - Vanguard U.s. Momentum Factor ETF right now?
Before you buy stock in Vanguard Wellington Fund - Vanguard U.s. Momentum Factor ETF, consider this:
The Motley Fool Stock Advisor analyst team just identified what they believe are the 10 best stocks for investors to buy now… and Vanguard Wellington Fund - Vanguard U.s. Momentum Factor ETF wasn’t one of them. The 10 stocks that made the cut could produce monster returns in the coming years.
Consider when Netflix made this list on December 17, 2004... if you invested $1,000 at the time of our recommendation, you’d have $417,413!* Or when Nvidia made this list on April 15, 2005... if you invested $1,000 at the time of our recommendation, you’d have $1,341,294!*
Now, it’s worth noting Stock Advisor’s total average return is 950% — a market-crushing outperformance compared to 212% for the S&P 500. Don't miss the latest top 10 list, available with Stock Advisor, and join an investing community built by individual investors for individual investors.
See the 10 stocks »
*Stock Advisor returns as of September 13, 2026.
Anthony Di Pizio has no position in any of the stocks mentioned. The Motley Fool has positions in and recommends Advanced Micro Devices, Applied Materials, Intel, Micron Technology, and Nvidia. The Motley Fool has a disclosure policy.
Recommended Articles


