


The Stock Market Is Flashing a Warning Signal So Rare It's Only Appeared Once Before. Here's What History Says Comes Next.
Key Points
Valuations are soaring, and the market right now is starting to resemble the dot-com era.
While no one can predict the market's short-term performance, it's wise to exercise caution right now.
Over time, the market is incredibly likely to earn positive total returns.
- 10 stocks we like better than S&P 500 Index ›
After months of turbulence, the stock market is surging again as investors gain renewed optimism. The S&P 500 (SNPINDEX: ^GSPC) and Dow Jones Industrial Average (DJINDICES: ^DJI) both reached new record highs in August, and the Nasdaq Composite (NASDAQINDEX: ^IXIC) is also inching toward a new peak, up by nearly 10% since late July alone.
The drawback to surging prices, however, is that this is the most expensive the stock market has been in decades. Not only are stock prices themselves climbing, but valuations are also reaching staggering new heights -- increasing the risk that some stocks are overvalued.
Missed Nvidia in 2009? This Rare Signal Is Flashing Again. In 2009, a "Double Down" signal flashed for a little-known chipmaker called Nvidia. For the first time in years, that same "Total Conviction" signal is flashing for a company 1/100th the size of Nvidia. Continue »
Valuations aren't an exact science, so it can be tough even for the experts to gauge whether the market is in bubble territory. That said, there's one valuation metric displaying a pattern that has only been observed during the lead-up to the dot-com meltdown. Here's what investors need to know.

Image source: Getty Images.
Is a stock market crash coming in 2026?
It's impossible to say how the market will perform in the near term, but history suggests investors should exercise caution right now.
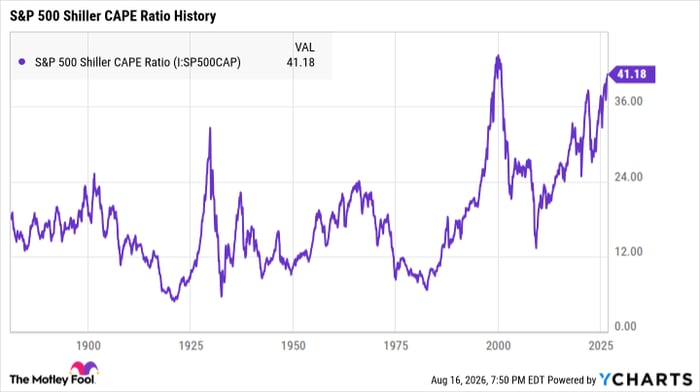
The S&P 500 Shiller cyclically adjusted price-to-earnings (CAPE) ratio provides a long-term assessment of the market's overall valuation. Historically, elevated ratios have led to lower average returns in subsequent years, and extremely high ratios are incredibly rare.
Since the 1870s, there have been only a handful of instances in which this ratio has surpassed 30. The first was in the 1920s, when it spiked to around 31, leading up to the Great Depression. In late 2021, just before the S&P 500 sank into a bear market that would last most of the following year, it surpassed 38.
The most severe surge, however, happened in the late 1990s. The CAPE ratio soared above 40 for the first time in history, peaking at around 44 in November 1999 -- around four months before the dot-com bubble officially burst.
S&P 500 Shiller CAPE Ratio data by YCharts
As of this writing, the CAPE ratio has been consistently above 40 since May of this year. This is only the second time in history that this metric has been this high for months at a time, making this market the most expensive in decades.
Is it safe to invest in the stock market right now?
No two bear markets are the same, so it's impossible to use past data to accurately predict how the market will perform going forward. But stock prices can't keep climbing forever. It's only a matter of time before companies become overvalued, at which point the market will correct itself.
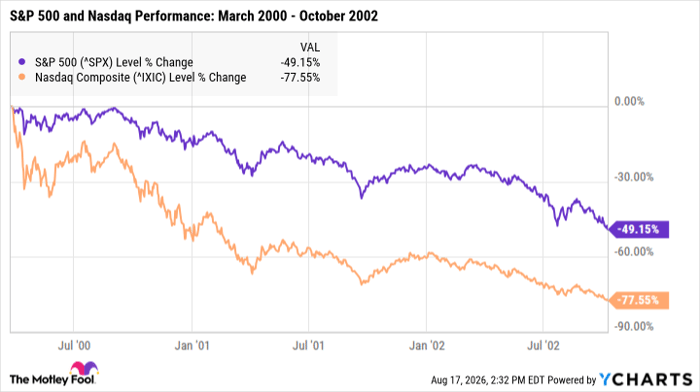
However, if history proves just one thing, it's that stocks will thrive over the long term. During the dot-com bear market, the S&P 500 lost nearly half of its value. The Nasdaq fared even worse, plunging by nearly 80% between 2000 and 2002.
^SPX data by YCharts
Some individual stocks were pummeled even harder. Apple, for instance, sank by a staggering 51% in a single day in late 2000, and Amazon lost nearly 95% of its value between 1999 and 2001. While those years were bleak, those stocks eventually became two of the largest, most successful companies in history.
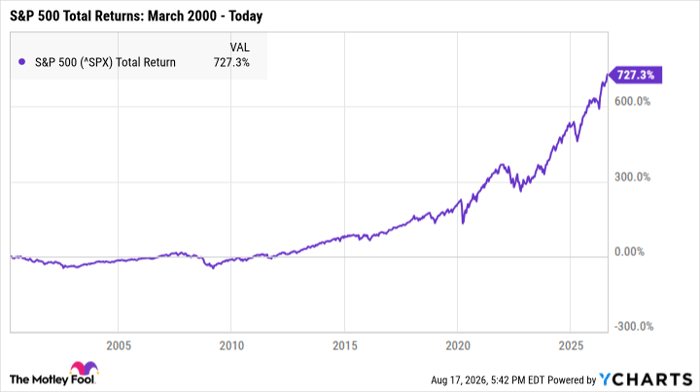
The broader market has also thrived over time. Since March 2000, the S&P 500 has earned total returns of more than 700%. In other words, if you'd invested $10,000 in an S&P 500 ETF the day the dot-com bear market officially began, you'd have nearly $83,000 by today.
^SPX data by YCharts
Not all dot-com stocks succeeded over the long haul, however. Some tech companies soared in valuation despite unsustainable business models, limited profitability potential, and poor leadership. When the bubble popped, many of those stocks never bounced back.
With valuations surging again, some stocks are overvalued. Those investments are the riskiest buys right now, as they may have the furthest to fall whenever the next pullback begins. But that doesn't mean investors should avoid the market altogether.
Strong stocks with solid underlying fundamentals have the best shot at surviving volatility and earning positive total returns over time. With the right investments, you can rest easier knowing your portfolio is protected no matter what lies ahead for the market.
Should you buy stock in S&P 500 Index right now?
Before you buy stock in S&P 500 Index, consider this:
The Motley Fool Stock Advisor analyst team just identified what they believe are the 10 best stocks for investors to buy now… and S&P 500 Index wasn’t one of them. The 10 stocks that made the cut could produce monster returns in the coming years.
Consider when Netflix made this list on December 17, 2004... if you invested $1,000 at the time of our recommendation, you’d have $409,970!* Or when Nvidia made this list on April 15, 2005... if you invested $1,000 at the time of our recommendation, you’d have $1,381,040!*
Now, it’s worth noting Stock Advisor’s total average return is 969% — a market-crushing outperformance compared to 215% for the S&P 500. Don't miss the latest top 10 list, available with Stock Advisor, and join an investing community built by individual investors for individual investors.
See the 10 stocks »
*Stock Advisor returns as of August 19, 2026.
Katie Brockman has no position in any of the stocks mentioned. The Motley Fool has positions in and recommends Amazon and Apple. The Motley Fool has a disclosure policy.
Recommended Articles


