


VIX Index Drops to 2026 Low: Why Caution Is Needed as US Stocks Hit Record Highs
TradingKey - As U.S. stocks continue to hit record highs, the Cboe Volatility Index (VIX), known as Wall Street's "fear gauge," continues to trend lower.
On August 17, the VIX fell intraday to around 14.18, hitting its lowest level since 2026. Compared with 31.65 touched on March 27, the index fell by more than 50% in less than five months.
Data released by Cboe shows that the average value of the VIX in July was 15.99, lower than 16.45 at the end of June, indicating that market pricing for future volatility continues to decline. Meanwhile, the S&P 500 Index has risen by about 16% year-to-date, while major stock indices such as the Dow Jones Industrial Average and the Nasdaq Composite Index have also successively entered record-high territory.
Rising stock markets and falling volatility typically occur simultaneously, but the current market environment is not lacking in risks. Uncertainties such as the Middle East situation, inflation changes, and long-term Treasury yields remain.
Against this backdrop, whether an extremely low VIX represents improving fundamentals or signals that investors have lowered their guard is becoming a central focus of debate on Wall Street.
Why the VIX Index Continues to Decline
The VIX primarily measures market expectations of volatility over the next 30 days based on S&P 500 index option prices. When investors increase demand for risk aversion and purchase more protective options, the VIX tends to rise; when the market continues to rally and hedging demand declines, the VIX typically falls.
So far this year, geopolitical conflicts and energy price volatility once pushed up market risk aversion, but these risks failed to persistently disrupt the upward trend in U.S. stocks. As inflation data moderated, economic growth remained resilient, and corporate earnings expectations improved, investors' concerns over a sharp short-term decline gradually diminished.
UBS believes that the VIX falling to a year-to-date low does not necessarily mean the market is trapped in irrational exuberance, but is more likely a normal response to improving fundamentals. Recent price pressures have eased, leading to decreased market concerns over further monetary policy tightening. If inflation continues to slow, the Federal Reserve will have greater leeway to extend its policy pause, thereby alleviating the pressure of high interest rates on equity valuations.
Corporate earnings have also provided support for current market sentiment. Earnings expectations for U.S. listed companies continue to be revised upward, while returns on artificial intelligence investments have begun to spread from a few mega-cap tech firms to broader industries. As long as the economy does not stall significantly, earnings growth could remain the primary driver propelling U.S. stocks higher.
Although U.S. retail sales unexpectedly fell 0.6% in July, marking a notable drop in recent months, UBS tends to view this as temporary weakness rather than a reversal in consumer trends. Credit card spending and manufacturing data still indicate that the economy possesses a degree of resilience, which is why some institutions believe the low volatility is supported by fundamentals.
However, the calmer market sentiment is, the less prepared investors typically are for unexpected developments. A low VIX indicates that the options market expects limited future volatility, but it does not mean that geopolitical, interest rate, or economic risks have vanished. Should actual conditions deviate from optimistic expectations, safe-haven trading could rapidly heat up, thereby amplifying the magnitude of any pullback in U.S. stocks.
US Stocks Enter Seasonally High-Risk Period: Could Midterm Elections Trigger a Pullback?
BTIG Chief Market Technician Jonathan Krinsky remains cautious about the current landscape. He believes that US stocks are entering the mid-August to mid-October period—traditionally prone to volatility—under conditions where indices are at record highs and volatility has fallen to annual lows.
Seasonal patterns in midterm election years are particularly noteworthy. Krinsky's data shows that since 1990, the S&P 500 Equal Weight Index in midterm election years has typically formed a local peak around mid-August and pulled back by an average of about 7% heading into mid-October.
Goldman Sachs' research over a longer timeframe also shows that since 1974, the median return for the S&P 500 Index from early August to Midterm Election Day has been near zero. After the election, as policy uncertainty subsides, the index has posted a median gain of about 6% over the following three months. This indicates that pre-election volatility does not necessarily imply a long-term bear market, but short-term risks are typically higher before the election than after.
In addition, geopolitics cannot be overlooked. Tensions in the Middle East, shipping through the Strait of Hormuz, and energy supply concerns could still rapidly push up oil prices and affect Federal Reserve policy expectations through inflation channels.
Axel Rudolph, chief technical analyst at IG, believes that while consecutive weeks of gains in US stocks reflect strong momentum, with volatility at low levels and potential risks continuing to build, investors may be underestimating the market's vulnerability to a new wave of bad news.
VIX Index Technical Analysis
Source: TradingView
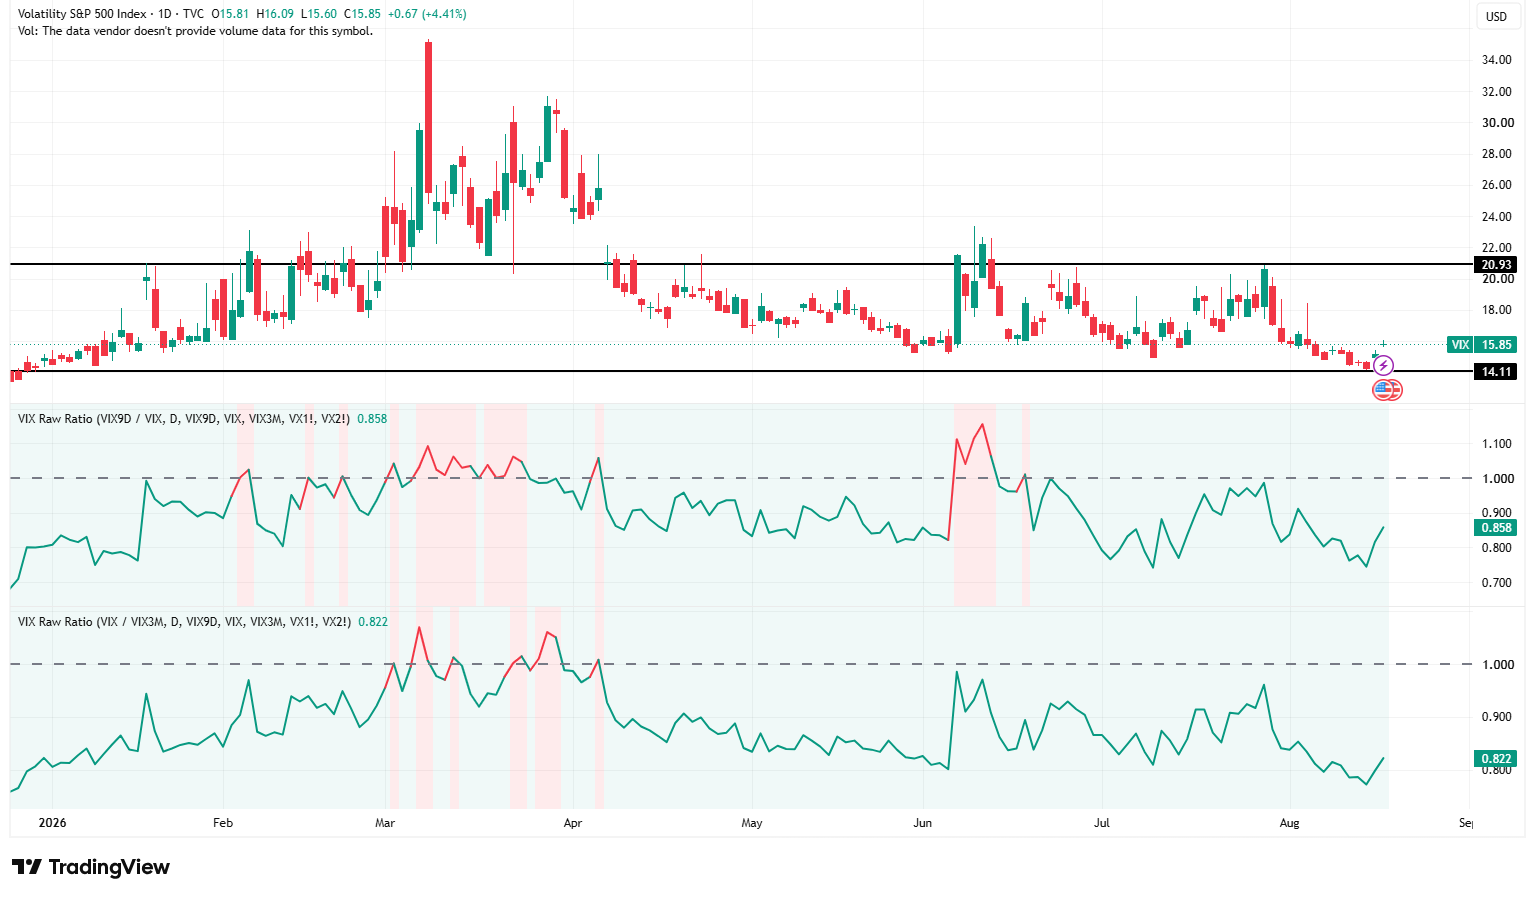
On the 17th, the VIX intraday fell to a year-to-date low of around 14.18, and has currently recovered to 15.85, but remains below its 20-day moving average of 16.39, with the medium-term downward structure remaining unchanged.
In the short term, attention on the upside should first be placed on 16.09 and 16.39; if it can hold above the 20-day moving average, further rebound targets look toward 17.2 and 18.0 to 18.5. Downside support is located at 15.60, 15.0, and the yearly low of 14.11.
The 14-day RSI currently stands at around 48.40, above its smoothed signal line of 44.15. The RSI rebounded from around 40 and crossed back above the signal line, indicating that the VIX's downside momentum is weakening and short-term momentum has improved. However, as the RSI has not yet broken above 50, it can only be viewed as an early recovery for now, rather than a definitive bullish reversal.
The term structure has also not yet confirmed panic conditions. The VIX9D/VIX ratio is 0.858 and VIX/VIX3M is 0.822. Although both ratios have recently bounced from low levels, they remain well below 1.00, showing that short-term risk pricing has not exceeded medium-to-long-term risk and the market remains in a normal upward-sloping term structure.
Recommended Articles


