


History Says Nvidia Is Going to Disappoint Wall Street After Aug. 26
Key Points
Nvidia is scheduled to reveal its fiscal second-quarter operating results after the closing bell on Aug. 26.
Wall Street's AI darling has a habit of crushing Wall Street's consensus sales and profit estimates, and this quarter is unlikely to be any different.
However, investors' expectations are often too lofty, resulting in multiday losing streaks after Nvidia reports its earnings.
- 10 stocks we like better than Nvidia ›
Although the bulk of earnings season is now in the rearview mirror, arguably the most consequential report is yet to come.
After the closing bell on Aug. 26, the face of the artificial intelligence (AI) revolution, Nvidia (NASDAQ: NVDA), will lift the hood on its latest quarterly operating results. As has been customary for much of the last four years, Nvidia is expected to blow past Wall Street's consensus sales and profit forecasts. But if history rhymes, once again, it won't be enough to drive the company's lofty valuation higher.
Missed Nvidia in 2009? This Rare Signal Is Flashing Again. In 2009, a "Double Down" signal flashed for a little-known chipmaker called Nvidia. For the first time in years, that same "Total Conviction" signal is flashing for a company 1/100th the size of Nvidia. Continue »

Image source: Nvidia.
Nvidia has made a habit of crushing analysts' estimates
Based on current estimates, Nvidia is expected to deliver nearly $91.9 billion in fiscal second-quarter sales (up 96% from the year-ago quarter) and earnings per share (EPS) of $2.08. With an average EPS beat of $0.065 over the last four quarters, Nvidia is hurdling profit expectations by roughly $1.5 billion per quarter.
There's no secret to Nvidia's formula for success. The company's graphics processing units (GPUs) are superior, and Wall Street's most influential businesses have shown a willingness to pay a premium for the best products in the AI arena. With no competitors particularly close to matching or surpassing the compute capabilities of Nvidia's core GPU lineup, it's been able to charge a hearty premium.
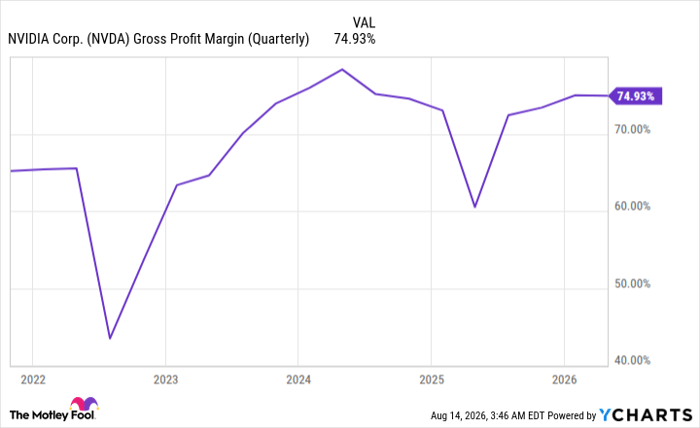
NVDA Gross Profit Margin (Quarterly) data by YCharts.
Additionally, Nvidia has been buoyed by a persistent GPU supply shortage. When demand for a good or service outstrips its supply, prices go up until demand tapers off. With no immediate end in sight to this GPU supply demand mismatch, Nvidia has consistently raked in a gross margin of around 75%.
Unfortunately for investors, Nvidia's headline figures tell only part of the story.

Image source: Getty Images.
History shows that losing streaks often follow Nvidia's operating results
Although history can't guarantee what's to come on Wall Street, past events have an uncanny ability to predict the future more often than not. In Nvidia's case, history predicts another losing streak following its upcoming earnings release.
Following each of Nvidia's previous four earnings releases, its shares have endured at least a two-day losing streak:
- Q1 2027: (1.77%) decline the following day / (3.64%) two-day decline
- Q4 2026: (5.46%) / (9.39%)
- Q3 2026: (3.15%) / (4.10%)
- Q2 2026: (0.79%) / (4.09%)
On average, Nvidia stock has dropped 2.79% the day after it reports its operating results and 5.31% over the two days following its quarterly earnings. For context, a 5.31% decline would shave $290 billion off Nvidia's valuation, based on its Aug. 13 close.
These persistent sell-offs after earnings likely reflect the otherworldly expectations that investors have placed on the face of the AI revolution. There's simply no earnings beat or sales/profit guide that would be sufficient to satisfy these lofty expectations.
Furthermore, historical headwinds are still working against Nvidia. Since the mid-1990s, we've yet to see a game-changing technology avoid an eventual bubble-bursting event early in its expansion.
AI finds itself on a path similar to the internet. While early adoption wasn't an issue for either game-changing technology, it took businesses until well after the dot-com bubble burst to optimize internet-based solutions. It'll likely take years before businesses are able to optimize AI solutions to boost sales and profits.
If history rhymes, yet again, Aug. 27-28 will mark a rough stretch for Nvidia's shareholders.
Should you buy stock in Nvidia right now?
Before you buy stock in Nvidia, consider this:
The Motley Fool Stock Advisor analyst team just identified what they believe are the 10 best stocks for investors to buy now… and Nvidia wasn’t one of them. The 10 stocks that made the cut could produce monster returns in the coming years.
Consider when Netflix made this list on December 17, 2004... if you invested $1,000 at the time of our recommendation, you’d have $421,511!* Or when Nvidia made this list on April 15, 2005... if you invested $1,000 at the time of our recommendation, you’d have $1,381,960!*
Now, it’s worth noting Stock Advisor’s total average return is 981% — a market-crushing outperformance compared to 216% for the S&P 500. Don't miss the latest top 10 list, available with Stock Advisor, and join an investing community built by individual investors for individual investors.
See the 10 stocks »
*Stock Advisor returns as of August 18, 2026.
Sean Williams has no position in any of the stocks mentioned. The Motley Fool has positions in and recommends Nvidia. The Motley Fool has a disclosure policy.
Recommended Articles


