


Texas Instruments Inc Stock (TXN) Moved Down by 4.38% on Aug 18: A Full Analysis
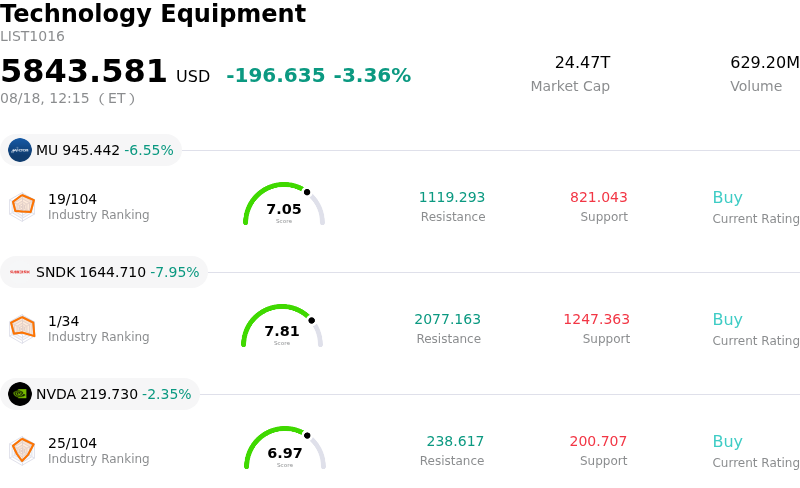
Texas Instruments Inc (TXN) moved down by 4.38%. The Technology Equipment sector is down by 3.36%. The company underperformed the industry. Top 3 stocks by turnover in the sector: Micron Technology Inc (MU) down 6.68%; SanDisk Corporation (SNDK) down 8.31%; NVIDIA Corp (NVDA) down 2.35%.
What is driving Texas Instruments Inc (TXN)’s stock price down today?
Texas Instruments experienced notable downside volatility as profit-taking swept through the semiconductor sector following an extended period of strong stock performance. Shares of the analog chip giant had rallied significantly earlier in the year on expectations of an operational recovery across key end markets, leaving the company trading at a premium valuation multiple compared to broader semiconductor peers. As broader technology equity sentiment shifted toward defensive positioning, institutional investors took the opportunity to harvest gains, amplifying intraday selling pressure across analog chipmakers.
From an operational perspective, market participants continue to weigh the company's aggressive multi-year capital expenditure program against near-term cash flow metrics. While heavy investments in domestic 300mm wafer fabrication facilities provide strategic supply chain advantages and long-term manufacturing cost benefits, they also carry elevated structural depreciation costs. During periods of broader market risk aversion, institutional investors often scrutinize high capital intensity and the pace of free cash flow conversion, leading to temporary price adjustments across the sector.
Despite intraday trading turbulence, fundamental drivers within key end markets remain active. The broader semiconductor industry continues to benefit from a recovery in automotive and industrial demand, supplemented by growing requirements from data centers and domestic supply chain commitments like expanded manufacturing agreements with appliance manufacturers. However, macroeconomic uncertainty, broader market volatility, and fluctuating sentiment regarding global end-market order rates continue to prompt institutional portfolio realignments.
Technical Analysis of Texas Instruments Inc (TXN)
Technically, Texas Instruments Inc (TXN) shows a MACD (12,26,9) value of 1.683, indicating a neutral signal. The RSI at 49.520 suggests neutral condition and the Williams %R at 26.969 suggests buy condition. Please monitor closely.
Media Coverage of Texas Instruments Inc (TXN)
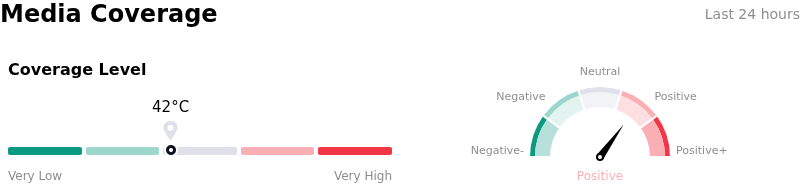
In terms of media coverage, Texas Instruments Inc (TXN) shows a coverage score of 42, indicating a moderate level of media attention. The overall market sentiment index is currently in bullish zone.
Fundamental Analysis of Texas Instruments Inc (TXN)
Texas Instruments Inc (TXN) is in the Technology Equipment industry. Its latest annual revenue is $17.68B, ranking 14 in the industry. The net profit is $4.97B, ranking 10 in the industry. Company Profile
Over the past month, multiple analysts have rated the company as Hold, with an average price target of $309.28, a high of $405.00, and a low of $184.59.
More details about Texas Instruments Inc (TXN)
Company Specific Risks:
- Elevated Valuation and Profit-Taking Vulnerability: Trading at an elevated forward P/E multiple near 35x following a year-to-date rally of roughly 60%, the stock faces heightened institutional profit-taking and multiple compression risks as valuation metrics stretch well above historical industry medians.
- Fixed Depreciation Costs and Gross Margin Compression: Multi-billion dollar capital expenditure commitments for domestic 300mm wafer fabs in Texas and Utah have elevated fixed depreciation and fab startup costs, creating a drag on gross margins if factory loadings lag behind newly added capacity.
- China Domestic Chip Expansion and Local Sourcing Risk: Accelerating mature-node foundry capacity from Chinese competitors, combined with "China-for-China" semiconductor mandates, threatens pricing power and market share in a region that historically accounts for over 20% of company revenues.
- Cyclical Revenue Concentration in Industrial and Auto Sectors: With over 60% of total revenue tied to the industrial and automotive segments, results remain vulnerable to inventory destocking and macroeconomic cooling in manufacturing, despite recent surge in data center demand.
Recommended Articles


