


If a Bear Market Is Coming, History Says This 1 Thing Is How Investors Can Still Win
Key Points
The S&P 500 Shiller CAPE ratio is a useful tool in measuring stock market valuation.
The CAPE ratio is currently hovering near its highest reading since the dot-com bubble.
Elevated CAPE readings are often followed by periods of sharp correction.
- 10 stocks we like better than S&P 500 Index ›
The stock market currently stands at historically elevated levels. With only a handful of companies accounting for an outsize share of the S&P 500's (SNPINDEX: ^GSPC) total valuation, this concentration creates genuine risk.
Widespread enthusiasm surrounding artificial intelligence (AI) and adjacent markets has so far been enough for investors to shrug off any perceived macroeconomic weakness. While this resilience is impressive, every bull market eventually faces a moment when the music stops. The question smart investors are asking is straightforward: What should one do when a bear market arrives?
Where to invest $1,000 right now? Our analyst team just revealed what they believe are the 10 best stocks to buy right now, when you join Stock Advisor. See the stocks »

Image source: Getty Images.
Understanding the CAPE ratio
The cyclically adjusted price-to-earnings (CAPE) ratio measures the market's current price relative to the average inflation-adjusted earnings over the past 10 years. By smoothing earnings across different economic cycles, the CAPE ratio better filters out the fleeting spikes and troughs that can distort ordinary price-to-earnings (P/E) snapshots.
A rising CAPE ratio means investors are paying incrementally more per dollar of earnings. That willingness usually reflects optimism about future growth, yet it subtly also compresses the margin of safety. In other words, when the CAPE ratio climbs meaningfully above its long-term average, the market is effectively pricing in perfection.
Analyzing prior CAPE readings
Today's CAPE reading of 41 is the highest since the late-1990s dot-com bubble peak. In fact, the CAPE ratio now sits within striking distance of an all-time high, spanning 155 years of data.
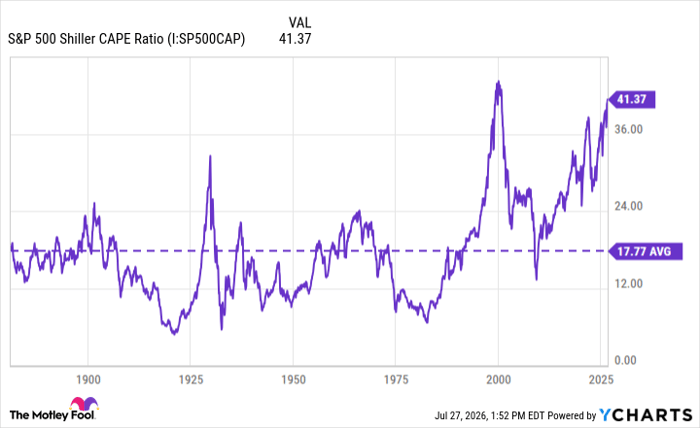
S&P 500 Shiller CAPE Ratio data by YCharts
History shows that when the CAPE ratio peaks, the market rarely follows with smooth sailing. Periods of elevated CAPE readings typically produce below-average returns over the subsequent years -- often in the low single digits or even negative as valuations slowly revert to the mean.
How can investors prepare for a bear market?
Preparing for a potential drawdown, recession, or outright bear market does not require a complete portfolio overhaul or frequent trading. The most durable defense begins with owning blue chip companies whose balance sheets, competitive positions, and cash flow generation have been battle-tested across multiple economic cycles. Maintaining deliberate cash reserves provides both psychological comfort and the financial flexibility to rebalance or add to positions when prices become more favorable.
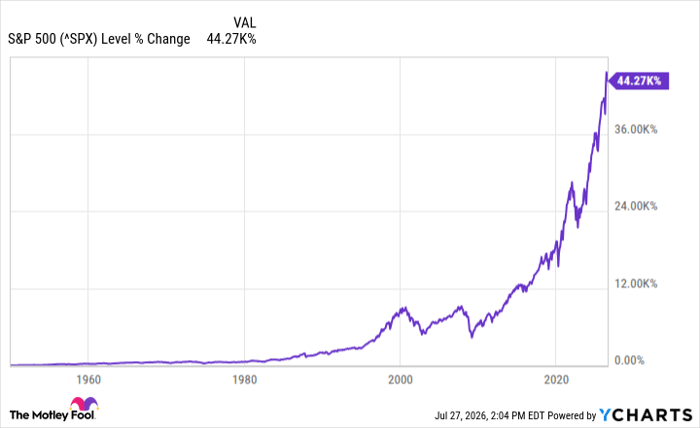
^SPX data by YCharts.
History demonstrates that the S&P 500 always emerges higher after every period of digestion, whether the declines last months or several years. Against this backdrop, the single most important action remains the simplest: Stay the course.
Time in the market consistently rewards those who resist the urge to abandon their portfolio at the moments of greatest discomfort. By investing in quality companies and supplementing sensible diversification with ample liquidity, investors will be positioned to endure temporary setbacks.
With this portfolio structure and long-term mindset, disciplined investors remain positioned to participate fully in any recovery that has, without exception, followed every previous bear market.
Should you buy stock in S&P 500 Index right now?
Before you buy stock in S&P 500 Index, consider this:
The Motley Fool Stock Advisor analyst team just identified what they believe are the 10 best stocks for investors to buy now… and S&P 500 Index wasn’t one of them. The 10 stocks that made the cut could produce monster returns in the coming years.
Consider when Netflix made this list on December 17, 2004... if you invested $1,000 at the time of our recommendation, you’d have $379,662!* Or when Nvidia made this list on April 15, 2005... if you invested $1,000 at the time of our recommendation, you’d have $1,206,116!*
Now, it’s worth noting Stock Advisor’s total average return is 886% — a market-crushing outperformance compared to 206% for the S&P 500. Don't miss the latest top 10 list, available with Stock Advisor, and join an investing community built by individual investors for individual investors.
See the 10 stocks »
*Stock Advisor returns as of July 29, 2026.
Adam Spatacco has no position in any of the stocks mentioned. The Motley Fool has no position in any of the stocks mentioned. The Motley Fool has a disclosure policy.
Recommended Articles


