


This Stock Market Valuation Metric Just Hit a Two-Decade High. Here's What History Says the S&P 500 Does Next.
Key Points
The S&P 500 has hit new record highs this year, but it's also near its most expensive valuation ever.
High market valuations typically precede crashes and corrections.
Whatever happens in the short term, the market's long-term future looks intact.
- 10 stocks we like better than S&P 500 Index ›
With the S&P 500 (SNPINDEX: ^GSPC) up more than 8% year to date, the market is gearing up for the fourth year in a row of gains. However, there are signs that the market is frothy. The S&P 500 could continue to thrive if valuations are in check and the economy is booming, but if valuations lose touch with reality, investors should definitely be concerned.

Image source: Getty Images.
Missed Nvidia in 2009? This Rare Signal Is Flashing Again. In 2009, a "Double Down" signal flashed for a little-known chipmaker called Nvidia. For the first time in years, that same "Total Conviction" signal is flashing for a company 1/100th the size of Nvidia. Continue »
The cyclically adjusted P/E ratio, or CAPE ratio, measures the S&P 500's total price-to-earnings ratio based on the past 10 years' worth of average earnings, adjusted for inflation, which smooths out the distortions of any one unusually good — or bad — year. That makes it a more reliable measure of the market's value than the standard average P/E ratio. Today, the CAPE ratio is at its highest level in more than 25 years and the second-highest ever.
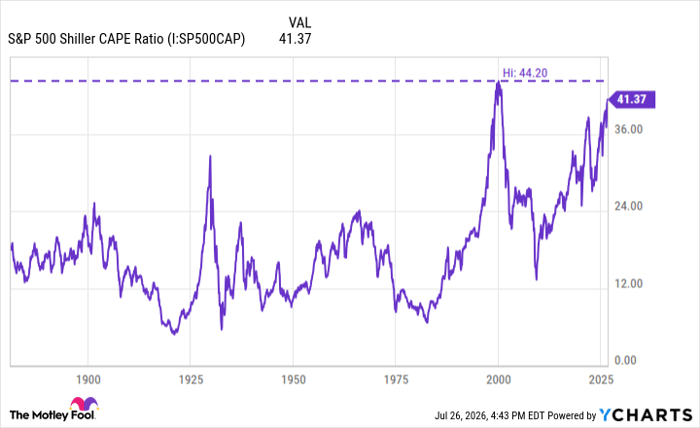
S&P 500 Shiller CAPE Ratio data by YCharts
Here's what history says happens next.
Out of touch with reality
The CAPE ratio reached its peak of 44 in 2000, during the dot-com bubble. The Internet was still early in its widespread adoption, and companies were jumping on the web bandwagon. They were spending money like it was going out of style, and while that spending was largely unprofitable, their valuations kept ramping up.
The resulting implosion was epitomized by the ill-fated Pets.com, which bled money and collapsed, but many other companies were in the same boat. The market plummeted, resulting in three consecutive annual losses between 2000 and 2002 and a total loss of 40%.
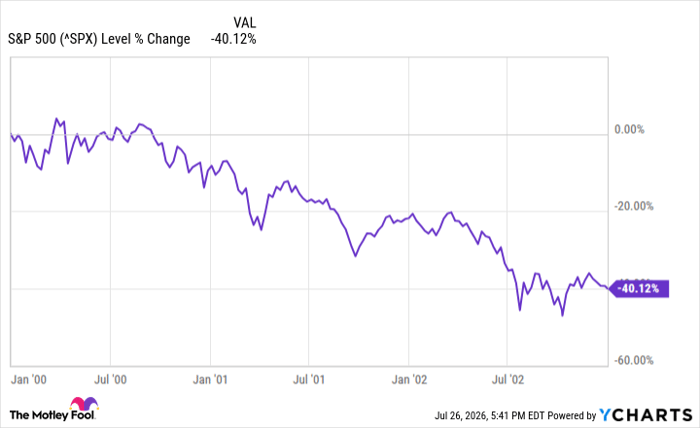
^SPX data by YCharts
There are many similarities between what happened then and what's happening now. Both times brought revolutions: the Internet then, and artificial intelligence (AI) today. Now, digital companies are selling things beyond the bounds of Earth itself, including moon landings and satellites, and there are matching valuations.
Bulls might say that this time is different from the dot-com bubble, because AI companies are highly profitable. However, that doesn't address the mounting CAPE ratio; companies may be profitable, but their stock gains are still outpacing their profit growth.
Is a market crash on the way?
This still doesn't mean that a market crash is imminent. There are parallels between then and now, as well as differences. Many of the most important AI companies are hyperscalers with decades-long track records of profitability, cash generation, and overall success. These aren't new, unproven companies that are asking for your confidence, but companies like Amazon and Alphabet, which are dominant in their spaces and backed by high-cash-generating businesses like Amazon Web Services and Alphabet's Google search.
However, there are many smaller AI-driven companies that rely on continued hyperscaler spending to keep growing and retain their high valuations, and many of these companies are barely profitable or not profitable at all, yet may sport fantastic valuations. Consider Iren, CoreWeave, and Applied Digital, which are all reporting losses but have all caught market attention as major players in the AI cycle.
The way to investing success isn't changing
There may not be an imminent market crash, but a correction is coming at some point. The high CAPE ratio points to it coming sooner rather than later, but the future is unknown.
The positive news for investors is that the market has always recovered and gone on to soar to new heights after any market crash or correction, and it's the best path to wealth for many Americans. In fact, the S&P 500 has gained 742% since it recovered in 2003.
Investors need to keep in mind that any market plunge could be deep and long, and they should plan accordingly. That includes building a diversified portfolio with around 50 stocks, plenty of which should be in the defensive and value sectors. Then, you can be comfortable investing in growth stocks, too, and feel confident about the long-term future of the market.
Should you buy stock in S&P 500 Index right now?
Before you buy stock in S&P 500 Index, consider this:
The Motley Fool Stock Advisor analyst team just identified what they believe are the 10 best stocks for investors to buy now… and S&P 500 Index wasn’t one of them. The 10 stocks that made the cut could produce monster returns in the coming years.
Consider when Netflix made this list on December 17, 2004... if you invested $1,000 at the time of our recommendation, you’d have $379,662!* Or when Nvidia made this list on April 15, 2005... if you invested $1,000 at the time of our recommendation, you’d have $1,206,116!*
Now, it’s worth noting Stock Advisor’s total average return is 886% — a market-crushing outperformance compared to 206% for the S&P 500. Don't miss the latest top 10 list, available with Stock Advisor, and join an investing community built by individual investors for individual investors.
See the 10 stocks »
*Stock Advisor returns as of July 29, 2026.
Jennifer Saibil has no position in any of the stocks mentioned. The Motley Fool has positions in and recommends Alphabet and Amazon. The Motley Fool has a disclosure policy.
Recommended Articles


