


Microsoft (MSFT) Q4 FY2026 Preview: Alphabet's Ominous Signal and the July 30 Test
TradingKey - Microsoft (NASDAQ: MSFT) is trading at $381.40 with a range of $380.65 to $389.03 on Saturday July 26. Its 52-week high is $555.45 and its 52-week low is $349.20. The stock is down approximately 20 percent year to date, and is trading at 20 times forward earnings, which is the most cheaply it has ever traded for a company growing revenue by 18 percent a year with Azure growing by 40 percent. The Q4 FY2026 earnings report comes July 30 after market close, with consensus estimating $87.7 billion in revenue and $4.24 per share earnings.
CNBC has already reported that Alphabet's post-earnings selloff should be treated as ominous read-through for Microsoft (and Meta and Amazon, for that matter). $376.90 as a trendline support level, and $388.73 on the 50-period exponential moving average are the technical levels to watch. And both Motley Fool pieces this week are predicting the stock goes parabolic after July 30.
Why the Bar Is Higher After Alphabet
Alphabet's (NASDAQ: GOOGL, GOOG) Q2 earnings report on July 22 did not cause a general technology sector selloff, it triggered a specific re-rating of the entire hyperscaler capital expenditure thesis. Google Cloud grew 82%, revenue was up 4.8% on the estimate, and operating margins expanded to 34%. Yet GOOGL still sold off by 15% after the fact, due to what investors interpreted as the threat to free cash flow from a $44.9 billion quarter (doubling YoY) of capital expenditure. CNBC specifically said that "the reaction to Alphabet after its Q2 earnings should be a warning for Microsoft, Meta, and Amazon investors." We now have a new market expectation: Capital expenditure growth must correlate with revenue growth acceleration, not just management's long-term thesis on future revenue growth.
For Microsoft this implies July 30 will not just be a report of whether or not the company "beat or missed" expectations. Even if MSFT reports exactly $87.7 billion in revenue and $4.24 per share earnings, as analysts currently expect, that is NOT where the market reaction will be driven. The move will be driven by how much more (or less) they expect growth for Azure in Q4 compared to this quarter's 40%. It will be driven by guidance on 2027 capital expenditures; Microsoft's $190 billion capex guidance is for calendar 2026, not FY2027.
Finally, the market is going to want to know if Copilot subscription revenue is growing fast enough to justify the infrastructure build out. If capex guidance is raised and Azure growth rates are down compared to Q3, we are on an Alphabet trajectory. If capex guidance is cut and Azure growth rates remain well above 35%, we might see the parabolic move that Motley Fool is forecasting.
What the Business Looks Like Heading In
Last quarter, Microsoft reported $77.67 billion in revenue, growing 18% YoY. EPS was $4.27, which beat the analyst expectation of
The city on the river was full of trade and had huge skyscrapers looming over old neighborhoods, with traders and people traveling everywhere and stories being told everywhere.
$4.13. Azure grew by 40%, which is faster than it has grown in over a year. The company is now onboarding 25 million paid commercial seats for Copilot in Microsoft 365 and over 20 million developers on GitHub Copilot. Microsoft Cloud annualized revenue is $192 billion and growing 22%. The company finished the quarter with $110 billion-plus in cash. Free cash flow is approximately $31 billion, and operating cash flow is about $37 billion. Q3 performance is on track or exceeding expectations on every metric.
On the product side, a pair of new releases further color the narrative as we head into Q4. Microsoft launched its MAI-Image-2.5-Pro, which is currently its highest-fidelity image generation, along with a new speech model called MAI-Voice-2-Flash into public preview on Wednesday. Both of these proprietary AI models will reduce reliance on OpenAI for model capabilities and provide another data point for Azure customers who would otherwise consider running workloads on competing clouds.
In other good news for its business prospects, Microsoft extended its longstanding partnership with Databricks well into the 2030s, making Azure the natural cloud for the platform’s enterprise customers and cementing a tight data and AI integration in Azure. Microsoft Frontier Co., a $2.5 billion AI implementation unit announced July 2, represents the commercial vehicle between Azure AI and enterprise customers, and the latter is yet another revenue stream the market has not yet factored into consensus estimates.
MSFT Technical Setup
On the daily chart, MSFT at $381.40 is holding up at the $376.90 pivot, where the ascending trendline drawn in March intersects the big horizontal level of support.
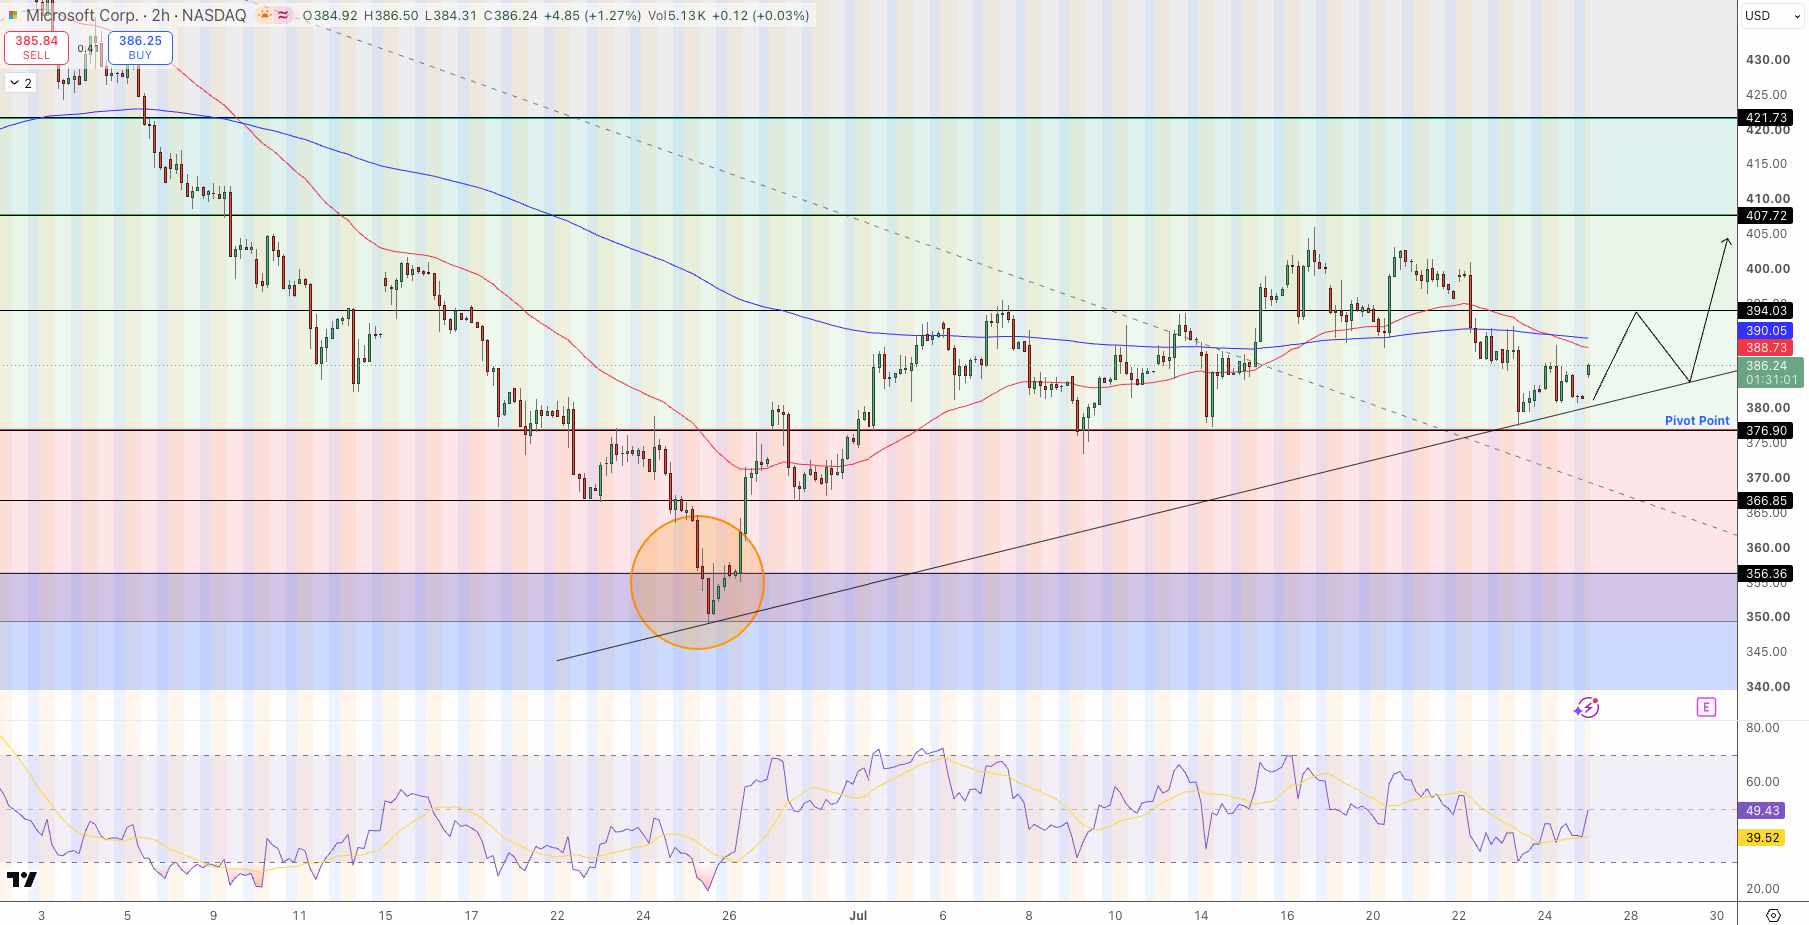
Microsoft (MSFT) Price Chart - Source: Tradingview
The RSI has recovered to roughly 49, indicating the sharpest selling has passed, though a trendline reversal hasn’t confirmed yet. The 50-ema at $388.73 and the 200-ema at $390.05 both sit a few dollars above the price. A confirmed daily close above $390.05 opens targets at $394.03, then $407.72, and finally $421.73.
On the downside, $366.85 and $356.36 are next support levels below the July 30 earnings call, a binary event.
Key Levels for the Week Ahead
- 52-week range: $349.20 to $555.45. Down ~20% YTD.
- Q4 FY2026 earnings: July 30, after close.
- Consensus estimates: $87.7B in revenue, $4.24 EPS.
- Last quarter: Revenue of $77.67B (+18% YoY). Azure +40%. EPS of $4.27, beating $4.13 estimates. FCF of $31B.
- Valuation: Trading at ~20x future earnings. The lowest valuation multiple in several years for 18% growth.
- Analyst price targets: Average of $552.27 from 50 analysts, 42 of whom rate the stock a strong buy. This implies ~41% upside from $381.
- Support levels: $376.90. Below that, look for $366.85 and $356.36.
- Resistance: $388.73 (50-ema), $390.05 (200-ema), $394.03, and $407.72.
What Three Things Does Microsoft Need to Show on July 30?
- Azure growth rate. Sustained growth above 35% next quarter, or even faster at over 40%, would reinforce the bull thesis for AI monetization. Slowing below 35%, however, would mirror the capex-to-revenue concerns plaguing Alphabet.
- Calendar-year 2027 CapEx guidance. Microsoft currently guided for $190B in 2026. If the FY2027 capex guidance is maintained or lower and Azure growth remains above 35%, concerns around free cash flow will ease and the stock will re-rate. If capex guidance is higher and there’s still no proportional Azure growth acceleration, then we’re repeating the Alphabet story.
- Microsoft has to show commercial Copilot seat growth of over 25M with the ARR per seat disclosed so that analysts can factor that ARR into FY2027 estimates.
Why Are Two Motley Fool Articles Predicting a Parabolic Move After July 30?
Both pieces this week say the same thing: at 20 times next year’s earnings, the MSFT stock does not include a premium for the AI business in spite of 40% growth in Azure last quarter and 25M commercial Copilot seats. If Azure growth next quarter is above 35% and the capex guidance does not exceed $190B, then the discount should snap into place.
There is no call on a particular surprise but rather a call that the current valuation is so materially below that trajectory, and the removal of the discount upon the earnings release that will confirm that trajectory.
The case for a big move is not a beat but rather a confirmation that the business is performing at a pace that the 50 analysts who cover MSFT and who have an average $552 price target say it is.
Bottom Line
Microsoft will be reporting Q4 FY2026 on July 30 with the street consensus of $87.7B in revenue and $4.24 EPS. The 20-times-next-year earnings multiple is the lowest in years in the eyes of the Street. The baseline of last quarter’s Azure growth at 40%, $31B in FCF, and 25M Copilot commercial seats is what MSFT investors want to be confirmed and extended next week.
The post-earnings selloff in Alphabet set the new standard that AI capex will need revenue growth acceleration and will not just be justified on faith in the AI thesis.
The $376.90 trendline support is the MSFT technical support and if that breaks then we will look down at $366.85; if MSFT can clear $390 then the EMA stack will break and we’ll look at $394 and $407 as the upside targets. July 30 will be the biggest MSFT event of the year.
Recommended Articles


