


Last Time the S&P 500 Crossed This Valuation Milestone, the Stock Market Crashed by 49%. Will History Repeat?
Key Points
The S&P 500 index is trading at its highest valuation since the peak of the dot-com bubble.
In 2002, the index was down by as much as 49% from its peak, and it didn't set another new high until 2007.
Artificial intelligence stocks are currently leading the S&P 500 higher, but cracks are starting to appear in the data center spending boom.
- 10 stocks we like better than S&P 500 Index ›
Despite some volatility attributable in part to the ongoing conflict between the U.S. and Iran, the S&P 500 (SNPINDEX: ^GSPC) index has still mustered a gain of 8% so far in 2026. Strong gains by technology stocks are offsetting some of the macroeconomic jitters, but history suggests this might not be sustainable for much longer.
Based on one widely followed valuation metric, the S&P 500 has only been this expensive on one other occasion in its entire history, and that was in 2000 at the peak of the dot-com bubble. What followed was one of the steepest declines investors have ever endured, and from the bottom of that trough, it took half a decade for the index to recover and begin setting new highs again. Is history about to repeat itself?
Where to invest $1,000 right now? Our analyst team just revealed what they believe are the 10 best stocks to buy right now, when you join Stock Advisor. See the stocks »

Image source: Getty Images.
The S&P 500 has almost never been this expensive
The S&P 500 is made up of 500 large-cap and megacap companies from all 11 different sectors of the U.S. economy, so it's highly diversified. However, because it's weighted by market capitalization and companies like Nvidia and Apple are currently the most valuable businesses in the world, more than a third of the value of the index today derives from stocks in the red-hot technology sector.
In May, the S&P 500 crossed a key valuation milestone. Its Shiller Cyclically Adjusted Price-to-Earnings ratio -- also known as the Shiller CAPE ratio -- rose above 40 for the first time since 1999. It's now 41.4, which is its highest level since 2000.
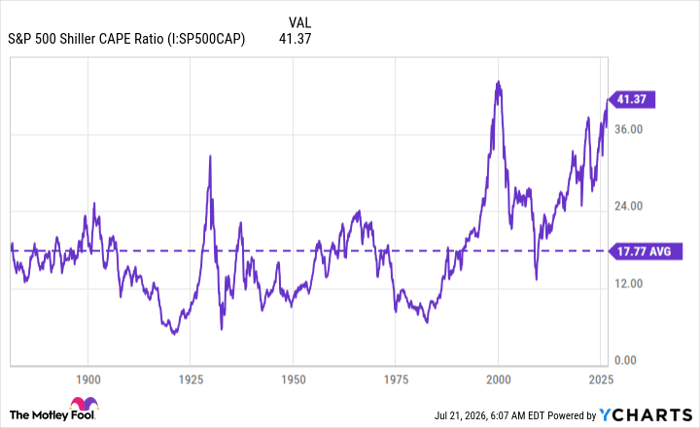
S&P 500 Shiller CAPE Ratio data by YCharts
The CAPE ratio is calculated by dividing the current price of the S&P 500 by the 10-year moving average of its inflation-adjusted earnings per share (the combined earnings of the index's 500 companies). It's often considered a more reliable measure of the index's valuation than the traditional P/E ratio, which only considers its earnings from the last 12 months.
The S&P 500 peaked around 12 months after its CAPE ratio crossed 40 in 1999, and during the two years after that, the index plummeted by as much as 49%. If a similar decline were to happen today, the S&P 500 would fall to around 3,880, a level not seen since the 2022 bear market.
To make matters worse, after the S&P bottomed out in 2002, it didn't fully recover and start setting new record highs until five years later in 2007. That means investors who bought the index after its CAPE ratio was above 40 probably didn't see positive returns on those investments for almost a decade. That's something retail investors will want to consider before initiating large positions at the current level.
The risks are piling up
The post-2000 crash was triggered by the bursting of the dot-com bubble. Investors piled into internet stocks in the late 1990s even though their fundamentals were on shaky ground. Many of these companies weren't even generating revenue as their prices were being bid up, hence their inevitable collapse.
Tech stocks are leading the current bull market, too, but this time, the driver is artificial intelligence (AI). Nvidia, Advanced Micro Devices, Broadcom, and Micron Technology have been some of the best-performing stocks in the S&P 500 since the AI boom started gathering momentum in early 2023, but their gains have come on the back of soaring sales for data center chips and components.
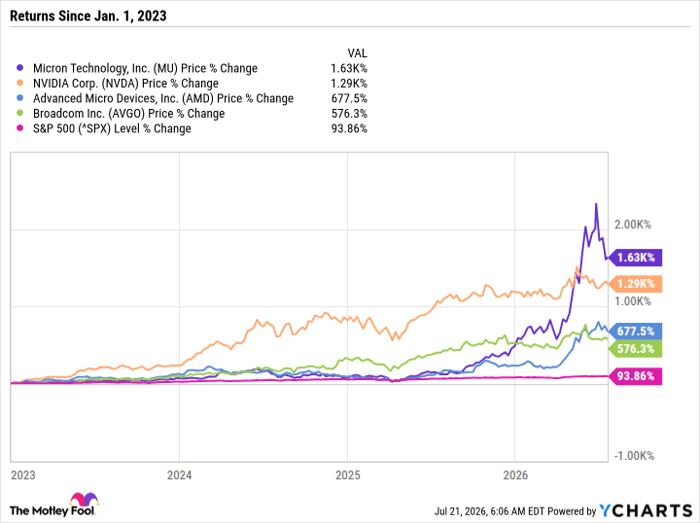
MU data by YCharts.
However, cracks might be forming in the data center infrastructure spending boom, as soaring costs are making it difficult for businesses to deploy AI software at an economical price. A recent survey by UBS Group found that 60% of businesses are curbing their AI spending by routing tasks to cheaper, more efficient models. Moreover, companies like Amazon, Uber Technologies, and even Walmart recently capped AI usage for their employees to keep costs under control.
As a result, most semiconductor stocks have already started pulling back, and a prolonged sell-off could weigh heavily on the S&P 500. But that isn't the only risk right now, because oil prices remain elevated due to the war between the U.S. and Iran, which is stoking broader inflation.
According to the CME Group's FedWatch tool, there is now an 82% chance that the Federal Reserve will hike the benchmark federal funds interest rate at least once before the end of 2026, which could be bad news for the stock market.
Therefore, it probably isn't a good idea to pile into stocks right now. That doesn't mean investors should get out of the market entirely, as market timing is a bad strategy. But it does mean they might want to trim some of their biggest winners to lock in some gains, use smaller position sizes when buying new stocks, and maintain a time horizon of at least five years on any investment to maximize their chances of earning a positive return.
Should you buy stock in S&P 500 Index right now?
Before you buy stock in S&P 500 Index, consider this:
The Motley Fool Stock Advisor analyst team just identified what they believe are the 10 best stocks for investors to buy now… and S&P 500 Index wasn’t one of them. The 10 stocks that made the cut could produce monster returns in the coming years.
Consider when Netflix made this list on December 17, 2004... if you invested $1,000 at the time of our recommendation, you’d have $364,562!* Or when Nvidia made this list on April 15, 2005... if you invested $1,000 at the time of our recommendation, you’d have $1,247,668!*
Now, it’s worth noting Stock Advisor’s total average return is 894% — a market-crushing outperformance compared to 207% for the S&P 500. Don't miss the latest top 10 list, available with Stock Advisor, and join an investing community built by individual investors for individual investors.
See the 10 stocks »
*Stock Advisor returns as of July 22, 2026.
Anthony Di Pizio has no position in any of the stocks mentioned. The Motley Fool has positions in and recommends Advanced Micro Devices, Amazon, Apple, Broadcom, CME Group, Micron Technology, Nvidia, Uber Technologies, and Walmart. The Motley Fool has a disclosure policy.
Recommended Articles


