


IBM Stocks Down 28% YTD After Record Crash; Wednesday Report Is the Reset
TradingKey - The most important week for International Business Machines in all of 2026 comes after the largest crash for its stock in history. On July 14 the stock was down more than 25% after releasing Q2 numbers which showed revenue and profits lower than expected. Now, the situation has only become more difficult with the start of an investigation of securities fraud for the alleged manipulation of a sales pipeline by the company executives.
The official Q2 earnings release is on July 22 and investors will be closely watching for updates to guidance, the status of deals, AI software progress, and the free cash flow.
What Happened on July 14 and Why It Matters
IBM had a 25.2% crash on July 14 after it released numbers for Q2 which were not in line with the market. The company reported Q2 sales growth of $17.2 billion which was just 1% growth versus 2Q25 where numbers came up short $660 million versus the $17.86 billion consensus. The adjusted EPS was reported at $2.93 a share which was $0.08 to $0.09 below consensus.
Arvind Krishna explained the decline by attributing the performance to an industrywide transition to AI infrastructure spending (i.e. servers, memory, and storage) which came at the expense of other spending categories and noted that some major software and consulting deals did not reach a close before the period ended.
Prior to the 2Q26 guidance warning, the company reported a strong start to the year in which 1Q26 revenue growth reached an annualised rate of 9% as earnings results easily surpassed Wall Street projections. The sudden slowdown is now raising doubts that enterprises are diverting their spending from software and infrastructure solutions towards AI hardware.
Investor confidence has been further shaken after a securities fraud probe was announced into whether IBM exaggerated its sales pipeline prior to its 7/14 earnings warning. The inquiry is still in the early phases and the company stated it is fully cooperating with authorities. Although no findings have yet been released, this legal and reputational threat could complicate management's efforts to regain the trust of Wall Street.
What Investors Need From Wednesday's Earnings Call
The Q2 results will not drive much stock price volatility on the initial earnings release since IBM already provided a pre-emptive earnings report. So, the 5:00 PM ET Wednesday conference call will instead offer up what shareholders will look to hear from management for an explanation. There will be four main topics that will likely be discussed. The initial inquiry will focus on clarifying how many deals in 2Q26 have closed as of July versus how many remain unaccounted for in a revised 2H26 outlook.
The second question will be to see if IBM maintains or updates 2026 guidance. Third, management's update on the Red Hat and watsonx segments will determine if the AI software strategy continues to find momentum despite enterprise spending slowdowns. Finally, free cash flow will be examined to determine if it supports the current dividend with a yield of 3% or more.
Although the company is continuing to roll out new product announcements including new Power Systems offerings and multi-agent capabilities for the AI market, any additional forward guidance provided will now carry more weight given the initial guidance warning and current fraud investigation. Management credibility may prove to be the biggest variable to keep an eye on.
IBM Technical Setup — $213.61 Fibonacci Floor, $201.58 Below, Key Levels
After trading around $212.20, IBM's current price position nears the bottom of the $213.61 level on the 4H chart. Every Fibonacci level above has become resistance since the July 14 decline: $233.16, $245.55, $255.74 and $265.37. It was noted that the RSI was unable to be verified by the original chart, although a drop as steep as this one would suggest a value in the deep oversold range near 30 or less. The $213.61 level represents the final meaningful reference level before $201.58.
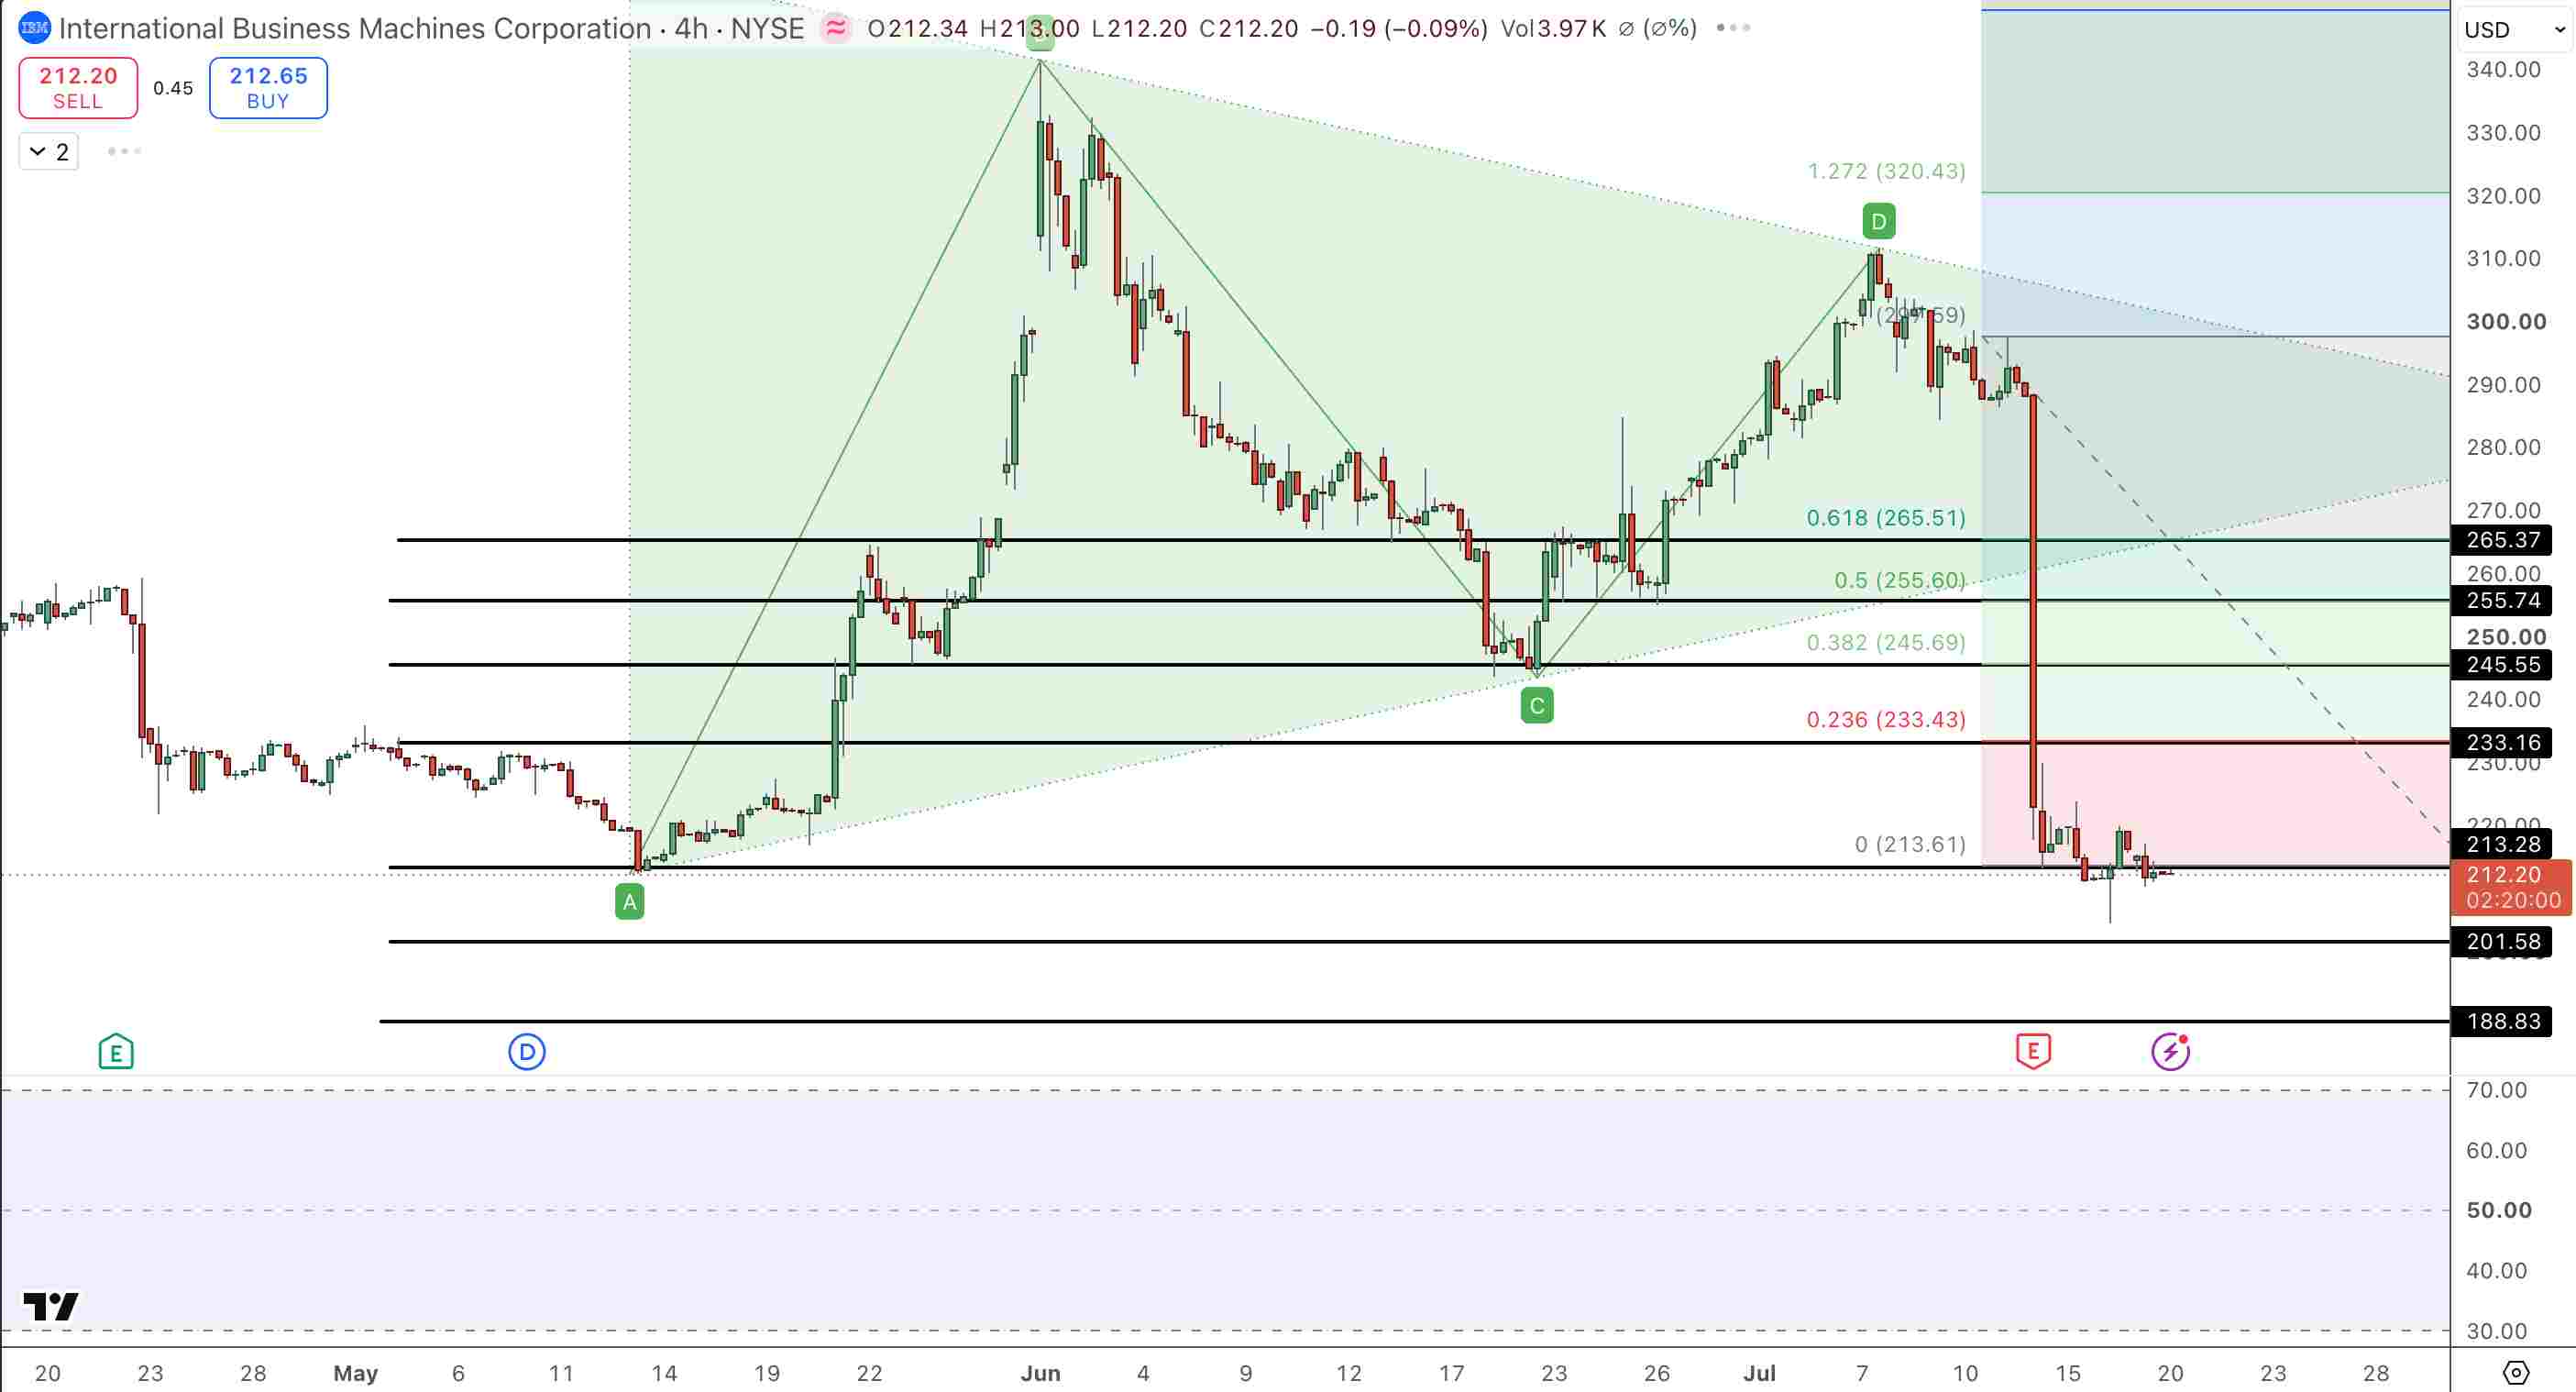
IBM Price Chart - Source: Tradingview
A break below the $213.61 level would suggest that the next test of support would be $201.58. Any rally above the $233.16 level would be the first confirmation that the downtrend may be losing momentum. The 5 PM call on Wednesday remains the key fundamental event that determines whether any level of price stabilization or further decline is to be expected.
- Q2 preliminary earnings report: Revenue $17.2 billion (+1% YoY, under $17.86 billion). Adjusted EPS $2.93 (missed $3.01 to $3.02 range).
- Q2 earnings report date: Released Wednesday July 22 after the close. Conference call at 5:00 PM ET.
- New concerns: Ongoing securities fraud investigation into whether IBM's sales pipeline statements prior to the July 14 guidance update were truthful and appropriate.
- Fibonacci pivot: $213.61 is at 0% Fibonacci. The $201.58 level is the next major support.
- Previous support as resistance: $233.16 is the first level to flip to resistance, followed by $245.55 and $255.74. These former lows now serve as ceilings.
- Dividend: IBM's dividend yield is above 3%. Its sustainability is dependent upon the Wednesday free cash flow update.
What Is the Securities Fraud Investigation Concerning IBM?
IBM's stock fell on July 14, which prompted an investigation into whether IBM executives misled the company's deal numbers prior to Q2 reporting. Investigators will try to determine if IBM executives made false statements regarding deal flow. They'll also examine whether shareholders that bought or held the stock during this time period suffered damages from the erroneous guidance. The investigation is in the beginning phase and IBM has said it will fully cooperate.
In addition to the regulatory risk of a formal probe, July 22 earnings release and call may now require scrutiny, especially regarding any forward-looking statements released by IBM executives.
What Must Be Disclosed in the July 22 Report for IBM to Rebound
Four main items must be clarified to determine if IBM stock holds or continues to fall following the 5:00 PM ET call on July 22:
- IBM needs to provide specifics on delayed Q2 deals and clarify how many deals have closed and which remain delayed.
- With the initial 2026 forecast predicated on second-quarter data that was incorrect, IBM needs to either reaffirm its long-term forecast or downgrade it.
- The call must cover Red Hat and watsonx revenue to determine whether the AI software pipeline is strong even without a strong enterprise agreements business.
- IBM will need to confirm a free cash flow forecast that supports a 3%+ dividend yield.
The key headline numbers are already known; we're looking at what is disclosed during the call and IBM's credibility and future.
The Bottom Line
IBM is down 28.1% year-to-date with a stock price of $212.67. Shares are resting on top of the $213.61 Fibonacci line after experiencing the company's worst day since 1968. In addition to reporting preliminary revenue of $17.2 billion and EPS of $2.93, IBM also has a securities fraud investigation in the mix of its official Q2 report on July 22.
On July 22, IBM will have to provide clarity on deals delayed and deals lost and announce a new 2026 forecast to provide context to the first two quarters of 2026. It'll have to report the revenue growth of Red Hat and watsonx and provide updated free cash flow guidance to sustain its 3%+ dividend yield.
If IBM can't hold above the $213.61 support level, then $201.58 will be the next price level of support. $233.16 is the first level to show that IBM is exiting the sell zone. HSBC has an $191 price target on IBM; however, GF Value thinks its intrinsic value is closer to $239.
Recommended Articles


