


Intel (INTC) Q2 Earnings Thursday; Up 163% YTD, Options Price 15% Swing
TradingKey - Intel (NASDAQ: INTC) is set to release its Q2 2026 earnings on Thursday, July 23, after the market has closed (with the conference call commencing at 2:00 PM PDT). The stock wrapped up Friday trading at $95.04, declining 2.00% as the overall semiconductor group tumbled. While Intel is up 163% YTD (Year-to-Date), positioning it as one of the top-performing large-cap semiconductor companies of 2026, the stock is down 17% after peaking during accelerated profit-taking on AI-related gains.
Currently, traders are betting on a 15% swing in either direction for the shares following its upcoming earnings report, which sits above the historical average move of 12.4% following post-earnings announcements. Analysts are projecting that Intel's Q2 revenues were $14.40 billion, with adjusted earnings per share of $0.10. That compares to a Y/Y revenue growth of 138.5%.
The 163% Gain vs. the 17% Correction
Intel's 163% YTD gain is a function of a fundamental re-rating through June of the stock's execution, which is based on steady progress on the 18A process, the Data Center AI segment growth and IFS being a true threat to the TSMC and Samsung Foundry duopoly. The market re-rating of the chipmaker is being validated by Q1 results: $13.6B in revenue, a Y/Y gain of 7%, $5.1B in Data Center and AI revenue (a 22% Y/Y increase), and a non-GAAP Earnings Per Share of $0.29 (Doubled Y/Y). It's also being confirmed by Q2 forward guidance of $13.8B to $14.8B revenues, $0.20 Earnings Per Share, and a 39% gross margin.
However, the 17% correction that Intel stock experienced recently is a result of a rotation in the market out of AI companies without real Nvidia-level revenue exposure. In Intel's case, the AI exposure is somewhat indirect, as data center clients of the chip giant are relying on their Xeon CPUs to power the networking, storage, memory, and compute infrastructure that feeds into their AI accelerators. As I've mentioned recently in "Intel Stock Stumbles as AI Euphoria Meets Reality," a post published in TipRanks on July 17, the market is wondering how Intel's underlying fundamentals are tracking to its current price momentum.
It appears that the options market is weighing the stock's potential reaction to tomorrow's earnings at 15%, a higher-than-average number. This will be revealed by what the report shows: Does it confirm Intel stock has been successfully transformed, or have investors run ahead of itself? Earlier this month, Susquehanna's Christopher Rolland lifted his target to $115 from $80, while keeping Intel stock rated Hold, as he expects Q2's server CPU sales to be strong. The consensus price target on the semiconductor stock is at $108.09.
Intel (NASDAQ: INTC) Technical Analysis: INTC (4H Chart)
The 4-hour chart depicts Intel at $95.04 rebounding from the $89.45 support level within a broader descending channel. Price is trading below both the 50-period EMA ($108.54) and 100-period EMA ($109.04). The RSI is near 36, suggesting oversold conditions but no immediate reversal yet.
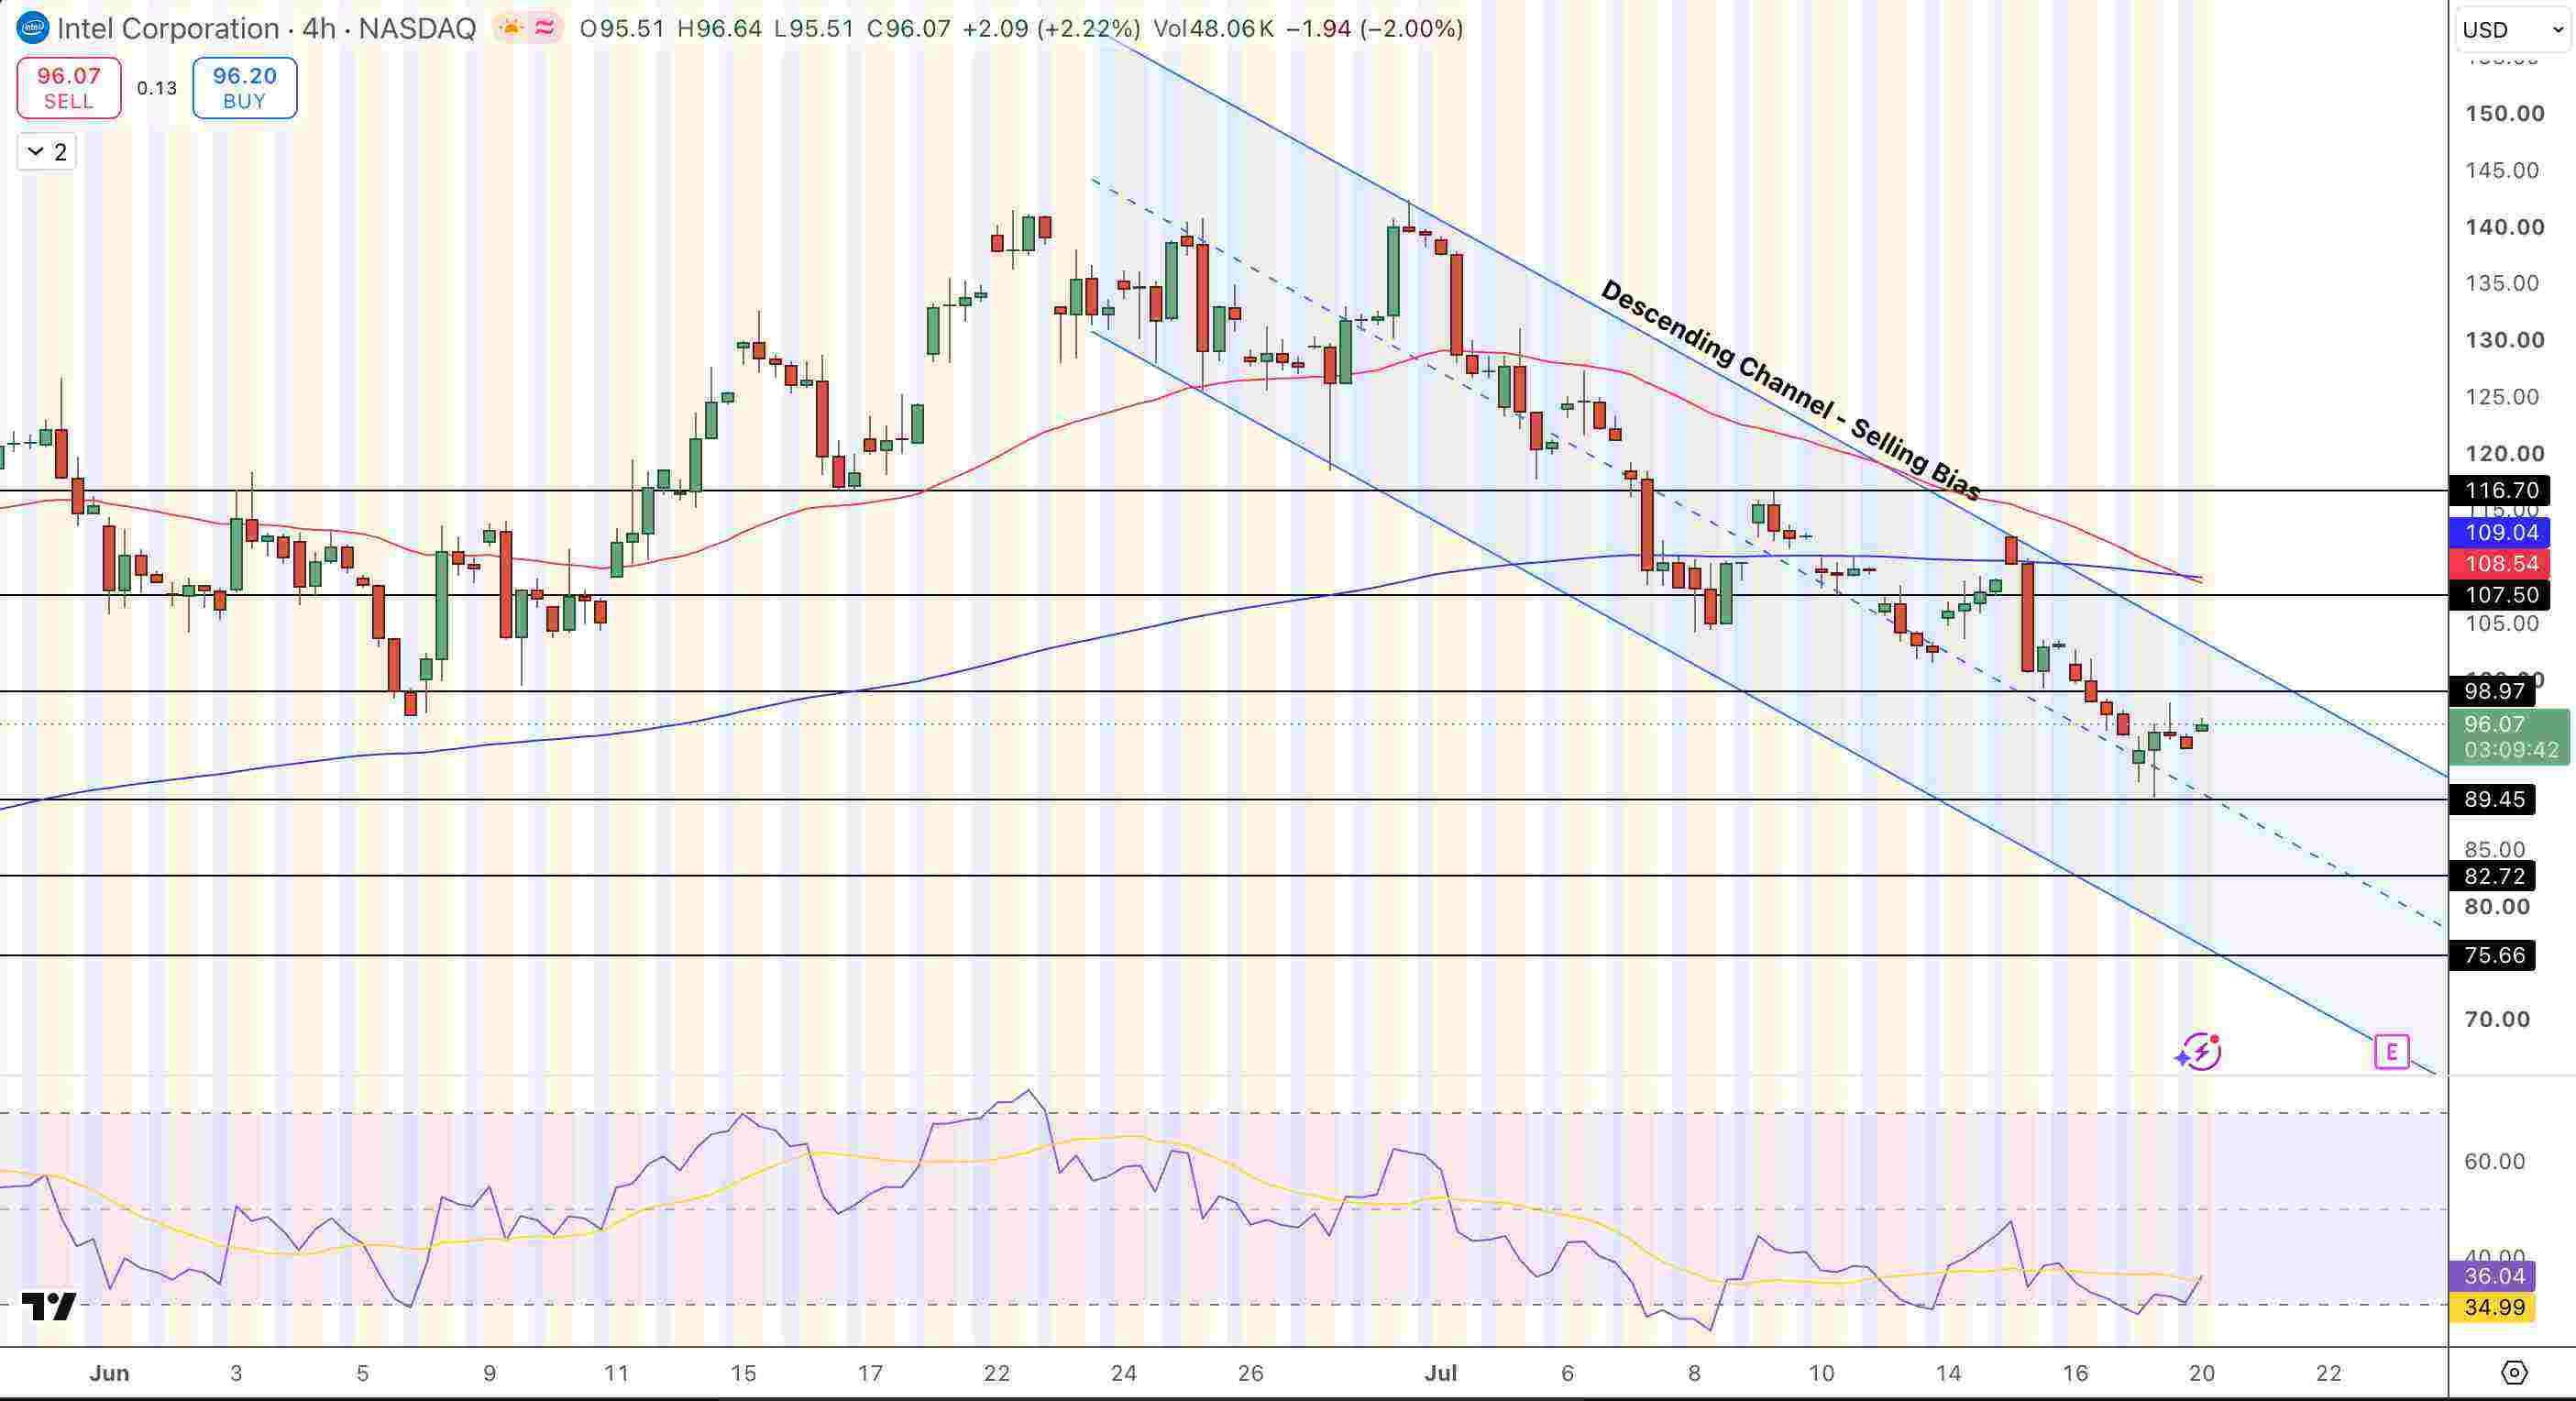
Intel (INTC) Price Chart - Source: Tradingview
For the bearish structure to weaken, Intel needs to reclaim the price resistance at $98.97 and then pierce through the EMA wall between $107.50 and $109. A strong earnings report detailing 18A and Foundry advancements could provide the necessary push. On the downside, a breach below $89.45 would open the door to $82.72, with $75.66 as the subsequent support target.
Earnings Preview Summary
- Earnings Release: Q2 2026, Thursday July 23, After Market Close.
- Analyst Estimates: Revenue $14.40B; EPS $0.10 (+138.5% YoY); Gross Margin ~39%.
- Options Sentiment: 15% implied move expected (vs. historical 12.4%).
- Year-to-Date Context: Up 163% in 2026 (Top performing large-cap chip), Down 17% from peak.
- Key Resistance: $98.97; EMA cluster $107.50 to $109 (Reclaiming EMAs needed for bull case).
- Key Support: $89.45; Downside targets: $82.72, then $75.66.
Why Is Intel Up 163% Year-to-Date and Still a Turnaround Stock?
The fact that Intel's YTD return is 163% is a result of a multiple re-rating in reaction to 3 things:
- Data Centre + AI revenue grew 22% YoY Q1 and was $5.1 billion (meaning Intel's Xeon CPUs are riding on the back of the overall AI infra boom and that Intel does not need to be the #1 provider in AI accelerators)
- Intel 18A progress has been better than what analysts were predicting a year ago, sparking hopes that Intel Foundry Services could become competitive with TSMC
- The overall infrastructure build out in AI has lifted all boats (including companies involved in data-centre compute, memory, networking, and manufacturing).
Intel's 17% decline from its peak last month is a byproduct of that same sector rotation in tech that saw Nvidia, AMD, and Micron get clobbered.
What Is Intel 18A and Why Do Analysts Think This Is Its Most Important Catalyst?
Intel 18A is Intel's most advanced process node, and is expected to reach maturity around the same time as TSMC's 2nm process, at which point Intel's 18A technology should compete on equal ground to TSMC in terms of transistor density, leakage, and performance. Intel 18A will also power its next-generation client CPU, Panther Lake, and the main product Intel Foundry Services will be pitching to potential customers who want to outsource chip production in search of an alternative to TSMC. Just last week, Intel reported that it has continued to make progress on 18A, specifically mentioning successful testing of ASML's High-NA EUV production equipment.
Commercial success for the 18A product is largely contingent on yield, the efficiency at which production ramps up, and how many external customers Intel is able to land. Investors will keep an eye on this week's call for any update on yields or customer qualification for 18A, as such a move would make the Intel Foundry Services business case all the more compelling.
Why Do Options Traders Expect a 15% Move in Intel After Thursday's Earnings?
Options markets anticipate a 15% move in Intel shares after its second-quarter results, due Thursday after market close, which is higher than the stock's 12.4% average move post-earnings over the last 12 quarters. The elevated implied volatility (IV) in Intel's options reflects the binary nature of Thursday's print for the stock's valuation today, where the share price is up a whopping 163% YTD and trading at above the average analyst price target of $108.09, prior to its pullback in the last month (17% drop to $95).
Any report in Q2 earnings that confirms or strengthens the 18A manufacturing outlook and Data Centre + AI growth trajectory would warrant the current valuation re-rating, and could lead to a retest of the EMA cluster at $107 to $109. Any negative print on either 18A progress or Data Centre + AI in Q2, or any cautious guidance on the broader foundry services business, could lead to a quick reversal of many of the gains for the year, as Intel's investment thesis is driven less by its current revenues and much more by future growth execution.
Bottom Line
Intel (INTC) is set to announce Q2 earnings on Thursday after the market close, and enters Thursday at $95, down -17% from its peak this year but up 163% YTD on the strength of the re-rating discussed above. Consensus revenue of $14.40 billion and earnings of $0.10/share are expected. The options markets are pricing a 15% move on the results.
Thursday's earnings release must confirm:
- Data Centre and AI revenue growth above 15% YoY
- Progress in 18A development, the confirmation of the launch of Panther Lake, and any new foundry customer news
- Guidance that validates its $17 billion annualized capital expenditure program.
INTC is trading in a downtrending channel on the 4-Hour chart, and the RSI is at 36. $98.97 is the first hurdle, with resistance concentrated at the EMA cluster at $107 to $109. A breakdown from $95 and a slide to below $89.45 would expose a downside move to $82.72.
Recommended Articles


