


The S&P 500 Is Flashing a Warning Sign Not Seen Since the Dot-Com Bubble. Here's What History Says Investors Should Do.
Key Points
Tech stocks are wavering, renewing fears around an AI bubble.
Data suggests the S&P 500 could be overvalued right now.
The right investment strategy is more important than ever to protect your portfolio.
- 10 stocks we like better than S&P 500 Index ›
The AI boom has lifted the stock market to new heights, with the S&P 500 (SNPINDEX: ^GSPC) doubling in the past four years alone.
However, tech stocks have been shaky in recent weeks, causing volatility in the broader market. The tech-heavy Nasdaq Composite (NASDAQINDEX: ^IXIC) is down more than 4% from its high, as of this writing, while the PHLX Semiconductor Index is nearing bear market territory, having fallen around 19% from its peak.
Missed Nvidia in 2009? This Rare Signal Is Flashing Again. In 2009, a "Double Down" signal flashed for a little-known chipmaker called Nvidia. For the first time in years, that same "Total Conviction" signal is flashing for a company 1/100th the size of Nvidia. Continue »
Recent turbulence has renewed fears surrounding an AI bubble. Around 43% of fund managers believe AI stocks are in a bubble, according to Bank of America's most recent Global Fund Manager Survey, compared with 48% who don't.
While that doesn't necessarily mean that a dot-com-like crash is looming, the stock market is sounding a similar warning right now. Here's what that means for your investments.
Image source: Getty Images.
Valuations are reaching historic levels
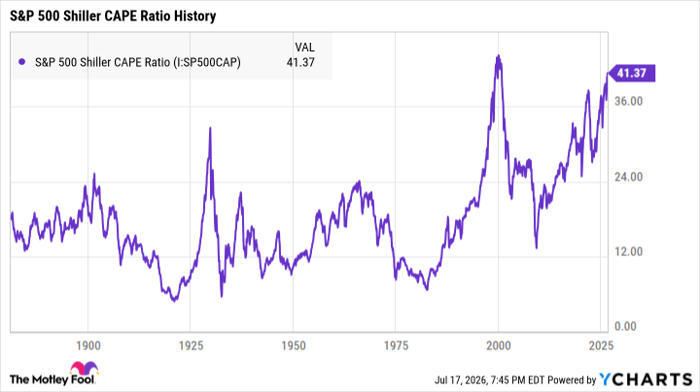
The S&P 500 Shiller CAPE Ratio measures the S&P 500's 10-year inflation-adjusted earnings to gauge the index's valuation over time. Because it uses a decade's worth of data, it provides a more complete picture of how the index has changed through multiple market cycles.
A higher metric suggests the index is trading at a premium and perhaps overvalued, while a lower figure implies it's undervalued. The S&P 500 Shiller CAPE ratio's long-term average is around 17, and it's been steadily creeping higher over the last decade or so.
Right now, the ratio is nearing 42 -- the highest it's been since the dot-com bubble, when it peaked at around 44.
S&P 500 Shiller CAPE Ratio data by YCharts
The Shiller CAPE Ratio has stayed above 40 since May, which is only the second time in history that it's remained this high. The first time was in January 1999, when it stayed above 40 until September 2000.
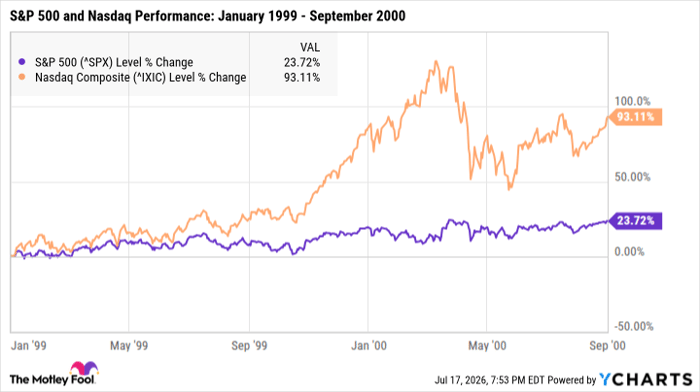
During that time, however, the market itself was not necessarily showing any glaring red flags. The S&P 500 surged by around 24% between January 1999 and September 2000, while the Nasdaq nearly doubled over that period.
^SPX data by YCharts
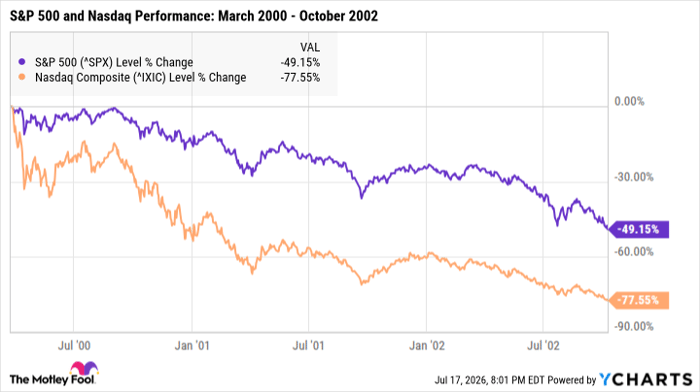
In hindsight, however, the dot-com bubble was already popping. The bear market officially began in March 2000, and between then and October 2002, the S&P 500 and Nasdaq plunged by around 49% and 78%, respectively.
^SPX data by YCharts
No metric is perfect, and past performance can't predict future earnings. But it's rare for the market to be this richly valued, so if there's one takeaway for investors right now, it's that choosing the right investments is more critical than ever.
The stocks most likely to survive a bubble
Regardless of whether we're in an AI bubble, the market will inevitably face some sort of pullback. When that happens, it will separate the strongest stocks from the weakest.
Hype is rampant within some corners of the stock market, and it's more tempting than ever for investors to buy in fear of missing out on lucrative gains. However, stocks fueled by hype carry the greatest risk -- similar to the internet companies of the 1990s that crashed and never recovered.
The stocks with the greatest long-term potential are those with solid business fundamentals. Nothing is guaranteed in the stock market, but healthy finances, a path to profitability, a competitive advantage, and other foundational strengths will go a long way toward surviving a recession or bear market.
Should you buy stock in S&P 500 Index right now?
Before you buy stock in S&P 500 Index, consider this:
The Motley Fool Stock Advisor analyst team just identified what they believe are the 10 best stocks for investors to buy now… and S&P 500 Index wasn’t one of them. The 10 stocks that made the cut could produce monster returns in the coming years.
Consider when Netflix made this list on December 17, 2004... if you invested $1,000 at the time of our recommendation, you’d have $371,842!* Or when Nvidia made this list on April 15, 2005... if you invested $1,000 at the time of our recommendation, you’d have $1,244,783!*
Now, it’s worth noting Stock Advisor’s total average return is 900% — a market-crushing outperformance compared to 207% for the S&P 500. Don't miss the latest top 10 list, available with Stock Advisor, and join an investing community built by individual investors for individual investors.
See the 10 stocks »
*Stock Advisor returns as of July 20, 2026.
Bank of America is an advertising partner of Motley Fool Money. Katie Brockman has no position in any of the stocks mentioned. The Motley Fool has no position in any of the stocks mentioned. The Motley Fool has a disclosure policy.
Recommended Articles


