


This Indicator Has Called Every Recession Over the Last 60 Years -- What It's Saying Now
Key Points
If you're looking for a way to prepare your portfolio before a recession hits, the Treasury market usually provides some signals.
Historically, the spread between the yields of the 10-year and 3-month Treasury bond has turned negative shortly before a recession begins.
This signal has appeared before the last six recessions.
- These 10 stocks could mint the next wave of millionaires ›
Trying to predict recessions is one of the most popular pastimes in the financial markets. There's a running joke that says certain people have predicted nine of the past five recessions. Fear tends to sell in the financial media, and there's no shortage of people trying to predict the next big crash.
Thankfully, actual recessions are fairly infrequent, but they are difficult to forecast. There are so many variables that go into any one individual economic environment that any one negative catalyst could be offset by another. There's no foolproof method to determine when an economic slowdown is coming. But there is one indicator that, historically at least, has been fairly reliable.
Missed Nvidia in 2009? This Rare Signal Is Flashing Again. In 2009, a "Double Down" signal flashed for a little-known chipmaker called Nvidia. For the first time in years, that same "Total Conviction" signal is flashing for a company 1/100th the size of Nvidia. Continue »
Image source: Getty Images.
How the Treasury yield curve is interpreted as a recession indicator
The 10-year/three-month Treasury yield spread is the signal I'm looking at. These two points on the curve are important for two reasons:
- The three-month yield closely tracks the federal funds rate. It essentially reflects what monetary policy is today.
- The 10-year yield, on the other hand, reflects the market's expectations for economic growth and inflation over the next decade. It can fluctuate significantly as expectations change over time.
The spread between them almost becomes a bet on the trajectory of Federal Reserve policy rates. Under normal conditions, long-end yields are higher than short-end yields because investors demand higher returns for lending their money over a longer time frame.
When long-term yields fall below short-term yields, there's a pendulum-swing effect in which the market anticipates the Fed will cut interest rates and bring the relationship back to where it traditionally sits.
This is what typically happens when the economy weakens enough to motivate the Fed to cut rates. In a sense, the 10-year/three-month yield spread becomes the market's own recession forecast.
The Treasury yield curve has effectively signaled past recessions
Since the 1960's, the 10-year/three-month Treasury yield spread has turned negative, on average, about six to 12 months prior to the onset of a recession. In most cases, it's flipped from negative to positive right before a recession as well.
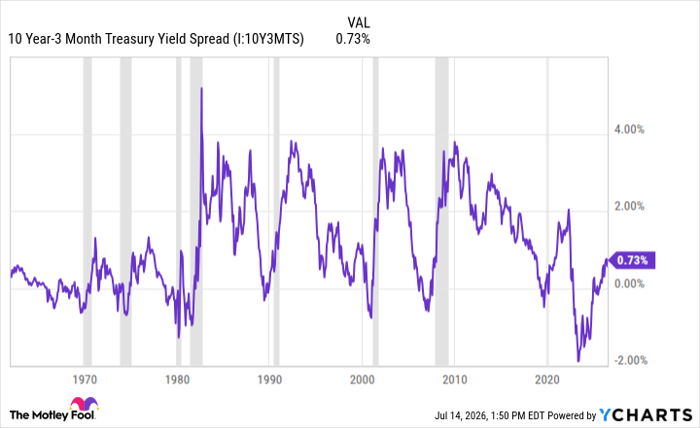
10 Year-3 Month Treasury Yield Spread data by YCharts.
This dynamic has preceded the last six U.S. recessions.
- 1980
- 1981-1982
- 1990-1991
- 2001
- 2007-2009
- 2020
The one outlier right now is the 2020s.
The 10-year/three-month Treasury yield spread saw one of its deepest and longest inversions ever, starting around the 2022 inflation scare/Fed rate-hiking cycle. The Fed has stopped raising rates (for now), and the spread has since returned to positive territory, but so far there's been no recession. Or it could mean that a recession is still coming. There's no way of knowing for sure.
Historically, this has been about as reliable a recession signal as you'll find. Right now, it's telling us we're in the window when a recession has traditionally occurred, based on what the Treasury market has indicated. At a minimum, it might be wise for investors to exercise a little caution here.
Where to invest $1,000 right now
When our analyst team has a stock tip, it can pay to listen. After all, Stock Advisor’s total average return is 930%* — a market-crushing outperformance compared to 210% for the S&P 500.
They just revealed what they believe are the 10 best stocks for investors to buy right now, available when you join Stock Advisor.
See the stocks »
*Stock Advisor returns as of July 18, 2026.
The Motley Fool has a disclosure policy.
Recommended Articles


