

Meta (META) Stock Price Outlook 2026: $55B Ad Quarter, $145B AI Bet — Is $540 the Next Stop?
TradingKey - Meta Platforms (NASDAQ: META) is trading at $583.68, having dipped beneath the rising trendline on the 4-hour chart. Meta posted Q1 2026 earnings on April 29 with total revenues of $56.31 billion, a 33% surge from the same period a year ago. Advertising revenues came in at $55.02 billion, with both ad impressions up 19% and the price per ad increasing 12% at the same time, offering what has been the clearest indication of positive developments in Meta's ad business over the past quarter or two.
AI tools enhanced the ad conversion rate by over 6%. Shares continued to slip after hours, with Meta also lifting its full-year 2026 capital expenditure projection to $125 billion to $145 billion. The market is wondering if and when the $145 billion Meta is spending on AI will become a return rather than an expenditure.
The Best Advertising Quarter in Meta’s History — and Why the Stock Sold Off
A 19% increase in impressions with a concurrent 12% price per ad hike in a single quarter is highly unusual in online advertising. Typically, only one indicator increases when the other declines due to volume dilution of pricing when there are more supply of impressions or volume decreases when prices increase due to pricing rigour.
The dual increase means Meta's advertising business has improved results for customers in its advertising network, as the Lattice and GEM AI models drove a 6%+ improvement in the ad conversion rate in Q1 2026, and it is the first time Meta has been able to put numbers against the impact AI technology has had on performance rather than just the qualitative statement.
Additionally, business AI on WhatsApp and Messenger saw 10 million weekly conversations, representing the first step on the roadmap to monetizing an AI service that goes beyond the core ad auction on Meta. Family DAU of 3.56 billion rose 4% YoY but fell over 5% sequentially from Q4 2025, the first decline in the metric ever. This sequential dip was due to two specific geo-political incidents that can be verified in the news reports, such as internet outages in Iran as a result of the US-Iran deal and an ad block in Russia following a ban on WhatsApp there.
Operating income of $22.87 billion at a 40.6% margin, net income of $26.8 billion and Q2 revenue guidance between $58 billion and $61 billion all speak to the underlying quality. GAAP EPS was $10.44 with an additional $8.03 billion of EPS provided by an income tax benefit as a result of the Trump tax and spending bill, for an EPS figure of $7.31 excluding that impact and higher than the market's expectations.
$145 Billion in Capex — The Question the Market Is Actually Asking
Meta has upgraded its 2026 capital spending outlook from a previous range of $60 to $65 billion to $125 billion to $145 billion across 2025 and early 2026. Capex in Q1 2026 was $19.84 billion on its own. If the $145 billion is all spent, the amount would be Meta's largest annual capital outlay in history by a massive amount, coming in a year Zuckerberg has called a "prove-it year" for the AI ROI.
That capex increase includes a $27 billion five-year capacity deal for GPU compute power from Nebius, a $14.3 billion stake in Scale AI that also resulted in hiring former CEO Alexandr Wang as CEO of the AI startup, and the creation of the internally-focused Meta Superintelligence Labs, which unveiled its first model in Q1. That $27 billion Nebius deal is big enough to have been the headline on the NBIS post during the last session.
The bull thesis for the capex is that Meta's advertising margin is 40% operating margin to spend $145 billion on capex per year and still see significant free cash flow on a trailing 12 months, and the 6% ad conversion lift for ads thanks to AI in Q1 is the start of a multi-year compounding benefit to advertising revenue that will make the capital outlay this year look cheap by later years.
On the other hand, $145 billion is now going into building AI infrastructure where it is getting harder and harder to track the incremental benefit, and the stock dropping from $700 to $583 since Q1 earnings suggests that investors are pricing in a higher rate of return in the future than Meta's "prove-it year" rhetoric suggests.
META Technical Setup — Trendline Break at $583, RSI 58, Short Target $540
On the 4H chart, META has broken through the rising black trendline with the red candles indicating sellers on top as well as the broader descending channel from $700-plus that is acting as resistance on the upside. RSI at 58.01 remains neutral with no divergence and there is plenty of room before the indicator reaches oversold territory.
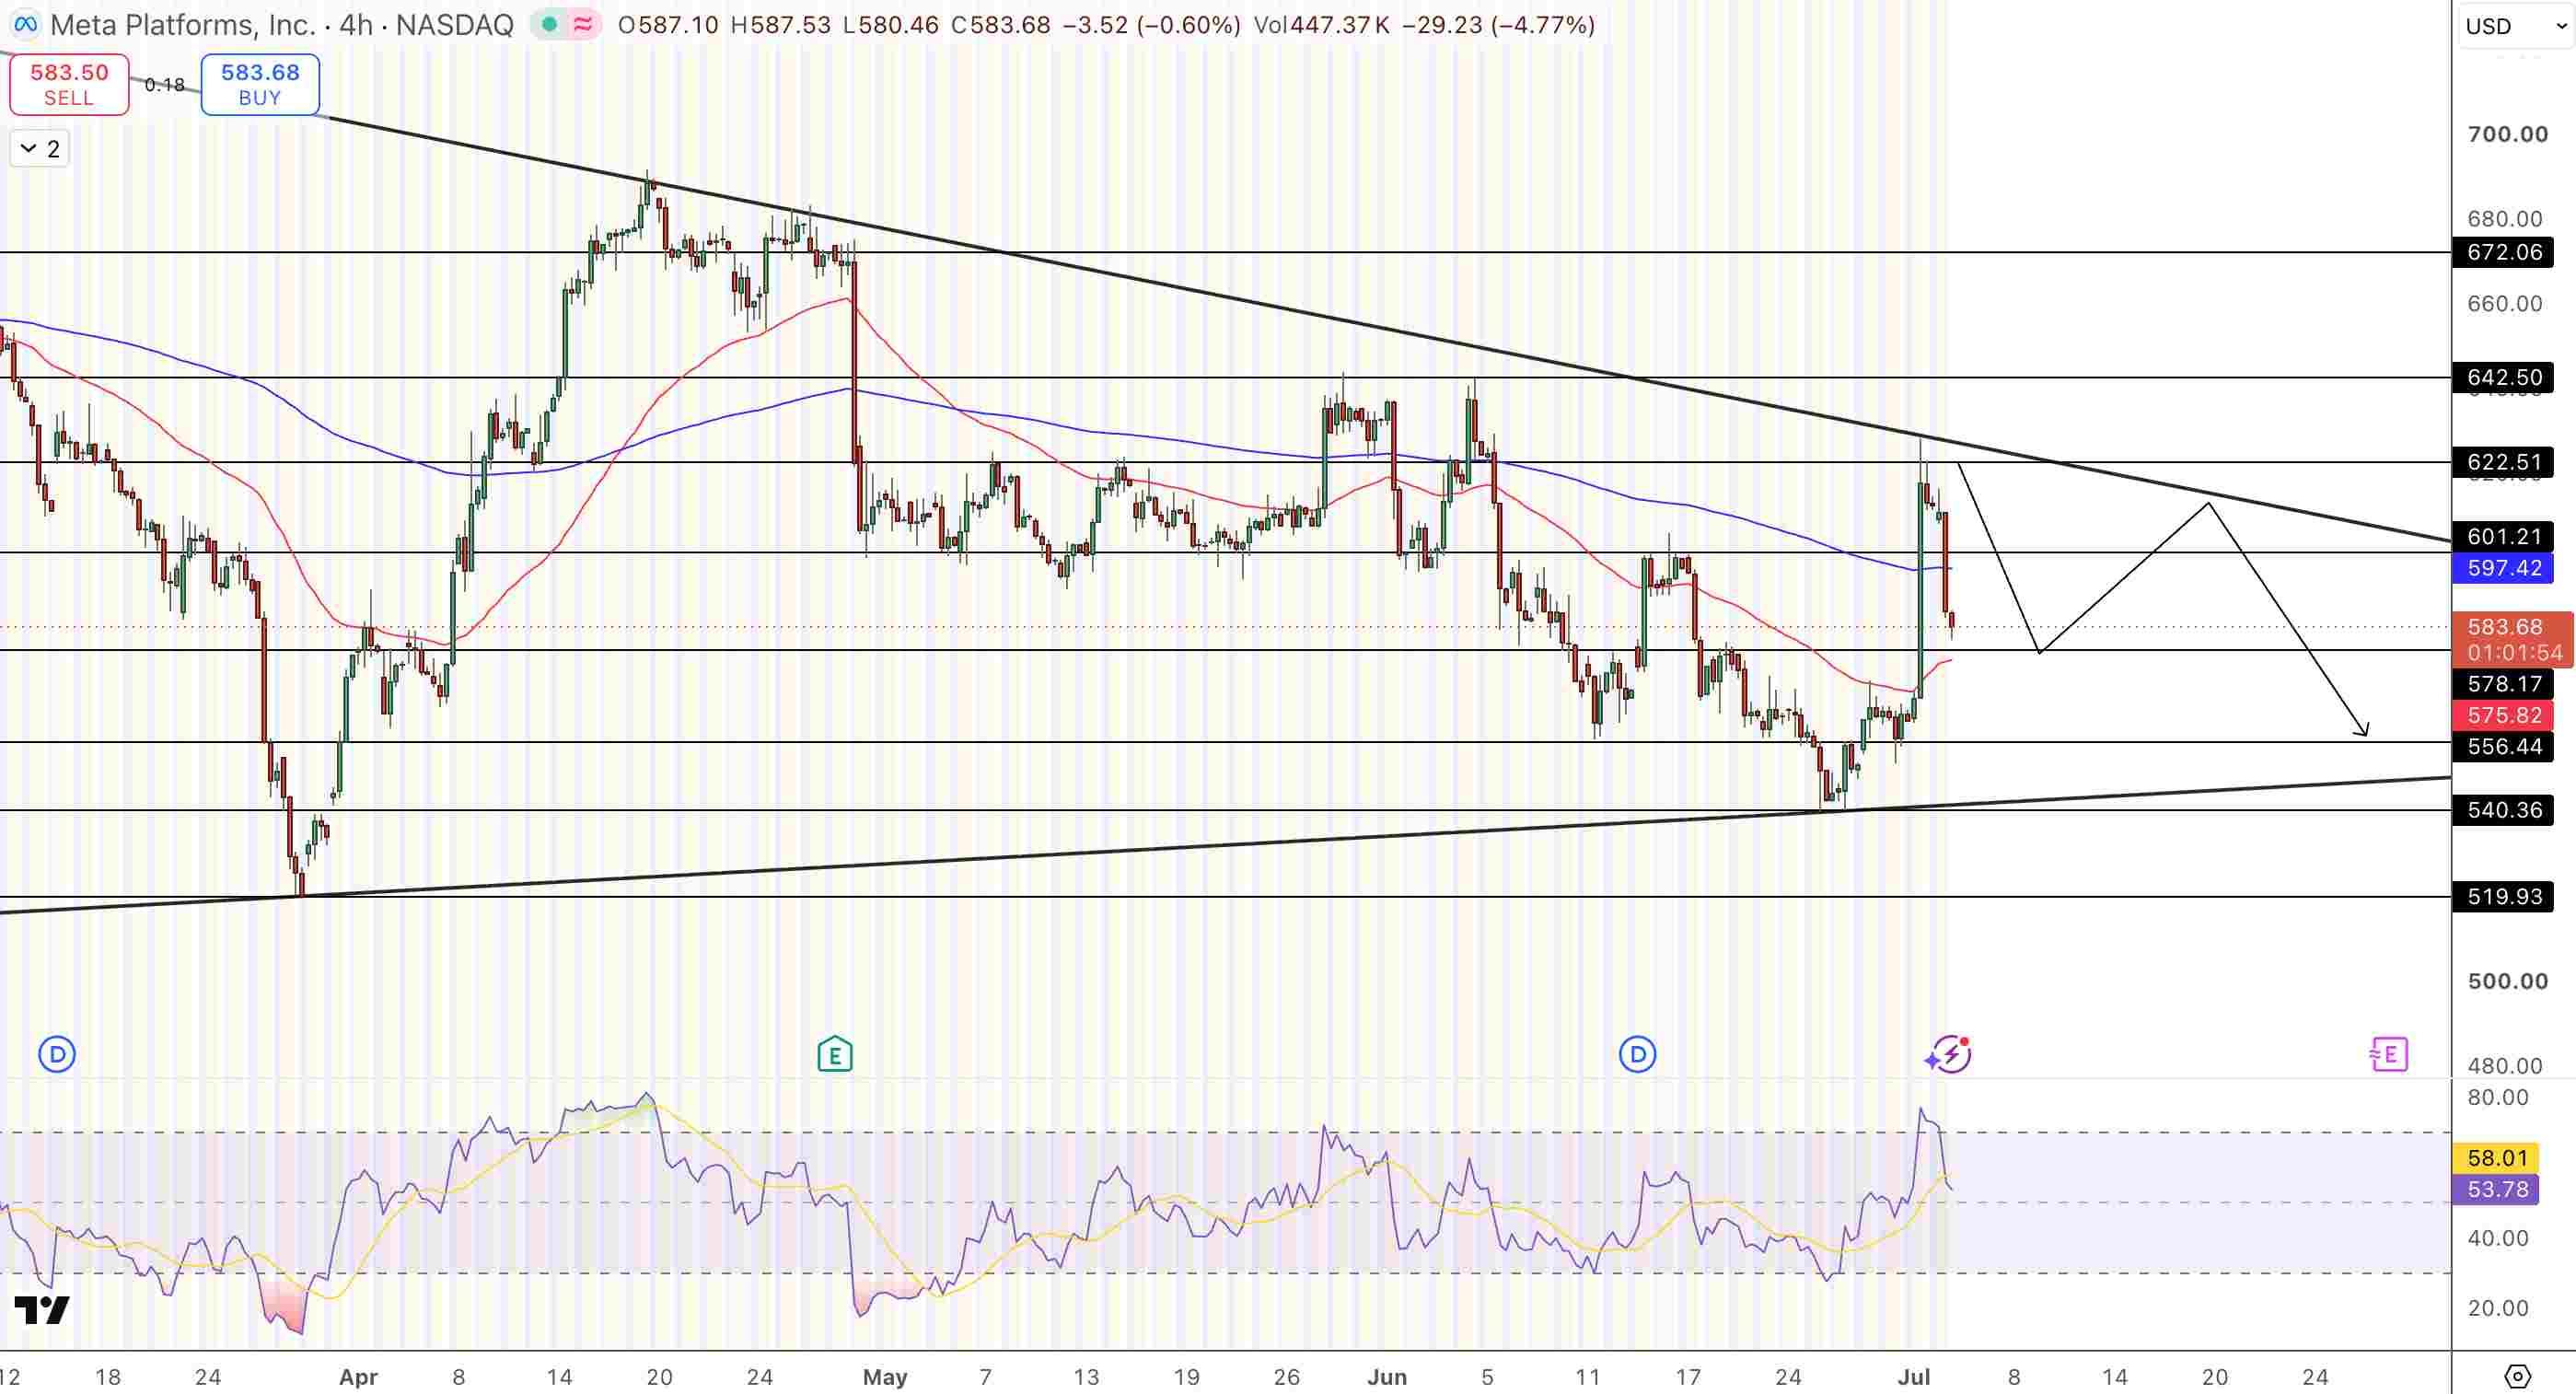
Meta (META) Stock Price Chart - Source: Tradingview
The key horizontal support area is at $556 to $540, and the descending channel would project META closer to $540.36 to $519.93. Short the break below $556, target $540 and stop above $597.
- Entry for the short: Below $556, which breaks horizontal support cluster.
- Target: $540, which is support projected from the descending channel.
- Stop Loss: Close above $597, which is a reclaim of descending channel upper limit
- Q1 2026: $56.31B revenue (+33%), impressions (+19%), price (+12%)
- 2026 Capex: $125-145B. Q2 guidance: $58-61B revenue.
- Earnings Next Up: July 29, 2026
Why Did Meta’s Stock Fall After a 33% Revenue Beat?
Meta Q1 2026 Revenue Was $56.31B (+33% YoY). The stock is dropping in after hours after Meta also raised the 2026 capex ceiling to $145B from the original capex guidance of $60 to $65B. This is a massive $145B guidance for capex in 2026, when Q1 2026 capex alone was $19.84B. Q1 2026 advertising revenue grew 33% YoY to $55.02B, but at the same time as 19% impression volume growth + 12% price growth. The stock has moved from $700 to $583.
What Is the $145 Billion Capex Actually Being Spent On?
$27B for a 5-year capacity deal with Nebius for dedicated GPU compute infrastructure and a $14.3B investment in Scale AI alongside the hire of CEO Alexandr Wang to lead Meta’s data and AI labelling operations. Also build-out of Meta Superintelligence Labs, which released its 1st AI model in Q1 2026.
Is META a Short or a Buy at $583?
Short is favored by chart: Meta $583 stock is in a descending channel from a $700 to $556 price level. Trendline is broken. RSI is 58, neutral. Room to continue lower in trend. Next technical support level $556 to $540 level. Technical stop level $597 for the short. The stock looks weak. It has a 40.6% operating margin. Q1 2026 $55B advertising revenue with a 19% increase in impression volumes and a 12% price growth. It looks strong in fundamentals and Q2 2026 revenue guidance is $58 to $61B.
This same fundamental problem we saw at NVDA is going to be the Meta story this Q2 2026. Q1 2026 revenue was $56.31B + 33% YoY. Q2 2026 revenue guidance is $58 to $61B. The AI investments, $145B in 2026 capex guidance and a massive AI buildout are going to impact the Meta multiple compression from a $700 high to a $583 stock. July 29, 2026 earnings is the next test.
Bottom Line
Meta $583.68 stock gave us a very strong Q1 2026 advertising quarter. It posted Q1 2026 $55B advertising revenue, impressions growing and pricing growing at the same time, AI tools quantifiably improved advertising ROAS or conversion rates by 6%, then raised 2026 capital expenditure capex to $145B stock, stock moved down $700.
The next test: Q2 2026 revenue guidance, $58 to $61B + July 29, 2026 earnings report. Is the AI investment cycle going to continue to accelerate the advertising compounding, and justify the stock price multiple at $583 versus a $700 stock? Chart continuation, if Meta $583 stock continues lower from a broken trendline below $556, next support level will be $556 to $540. Technical stop level will be $597.
Recommended Articles


