

Micron Stock Pulls Back After Surge, $1,000 Mark Is Ceiling or Starting Line

Source Tradingkey

TradingKey - Micron Technology's stock price undergoes a slight pullback, with a short-term downside potentially testing the $800 support level.

During the pre-market session on May 28, Eastern Time, Micron Technology ( MU) fell by over 3% at one point, hitting a low near $897. As of press time, Micron's stock narrowed its losses and returned above $900. Yesterday, the company's share price failed to break the $1,000 psychological barrier, peaking at $956. Moving forward, will Micron's stock price pull back or continue its rally?

Since the start of this year, Micron's stock price has surged continuously, gaining more than 200% cumulatively. This rally has been driven by multiple tailwinds, including strong earnings performance, public praise from President Trump stating that 'Micron is great,' and UBS analyst Timothy Arcuri's significant upward revision of Micron's price target.

However, while Micron has captured significant excess profits, Samsung and SK Hynix are expanding HBM capacity regardless of cost. This move could undermine Micron's current absolute pricing power, which is clearly a headwind for its stock price. Furthermore, Micron announced that it will release its latest quarterly earnings report on June 24, 2026. During the upcoming month-long earnings lull, the lack of further material catalysts makes it difficult for the stock to force a breakout above $1,000 on sentiment alone, likely leading to a structural sideways consolidation.

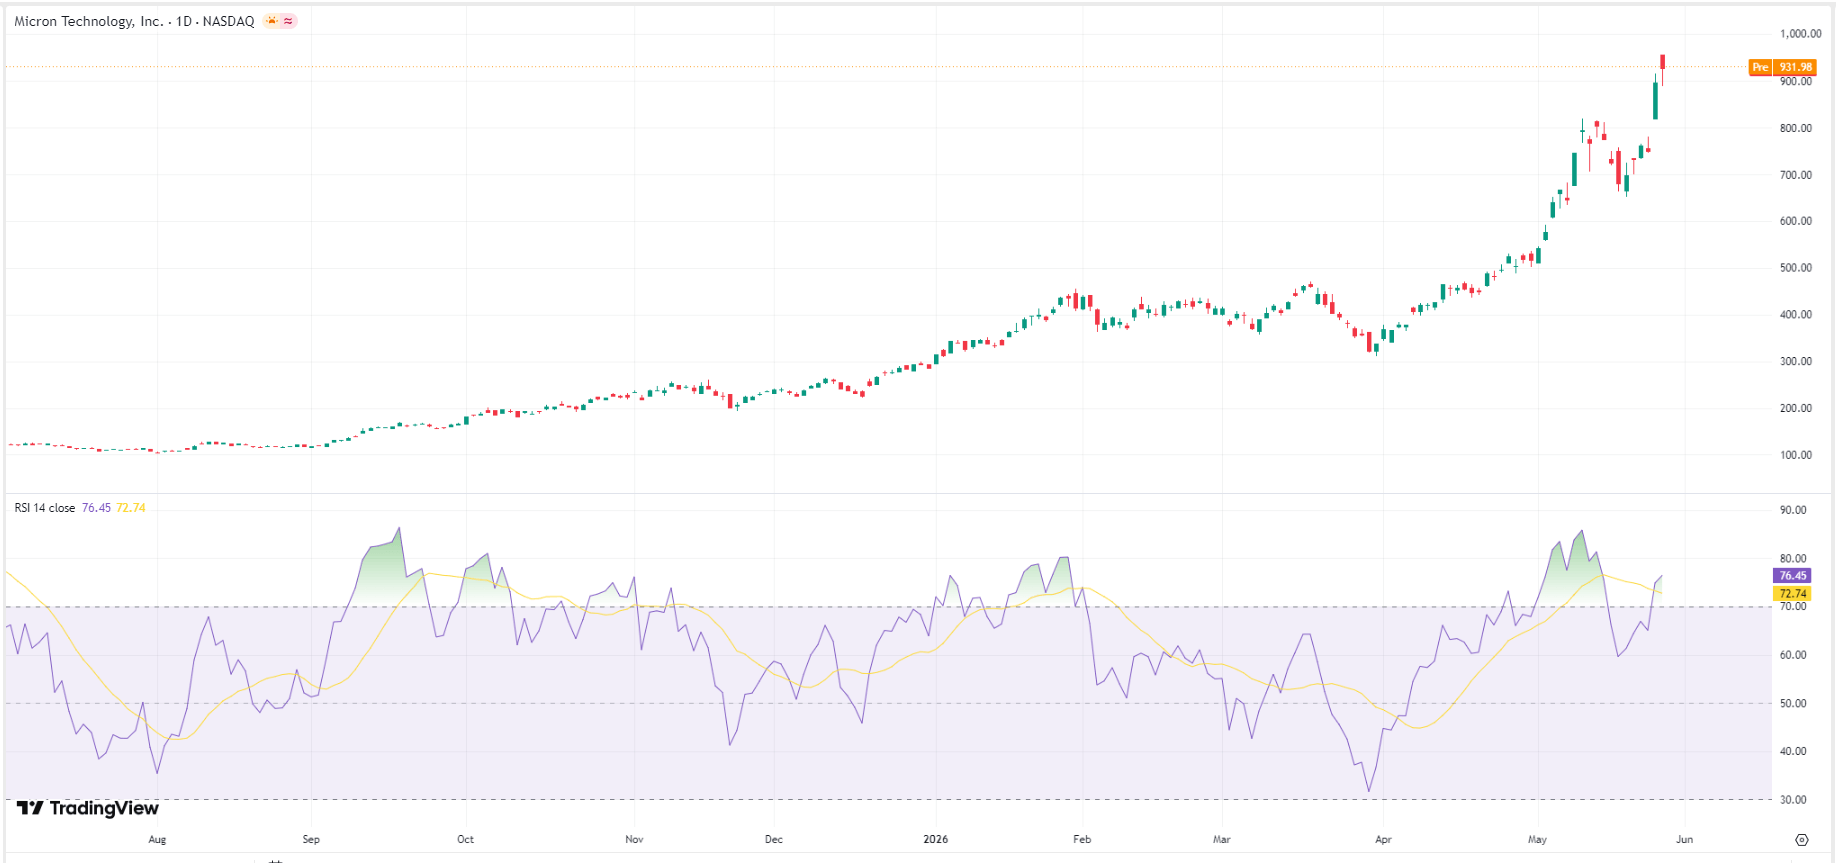
Moreover, no asset can rally in a straight line without looking back, and Micron is no exception. At the beginning of 2026, Micron's stock was trading near $315; it then skyrocketed nearly threefold in just five months, with the gain in May alone setting a historical record. In the short term, both daily and weekly indicators have entered extremely overbought territory. As the stock price approaches the massive psychological barrier of $1,000, long-term investors with significant unrealized gains and quantitative funds will inevitably have a strong urge to take profits, resulting in heavy selling pressure at these elevated levels.

From a technical perspective, the RSI has risen to 76 and is entering overbought territory, signaling that buying momentum is overheated and a collective sell-off could occur at any time. Although the exact timing remains uncertain, the risk of a correction has increased significantly. Looking ahead, Micron's stock price is highly likely to briefly break the $1,000 mark—creating a bull trap—before rapidly retreating to the $800 support level. In an extreme scenario, it could even drop toward $650.
micron-mu-price-c1f8bda27d2f4c07b45cd7e12bf7a701

Micron Technology stock price chart, Source: TradingView

Disclaimer: For information purposes only. Past performance is not indicative of future results.
placeholder
ECB Policy Outlook for 2026: What It Could Mean for the Euro’s Next MoveWith the ECB likely holding rates steady at 2.15% and the Fed potentially extending cuts into 2026, EUR/USD may test 1.20 if Eurozone growth proves resilient, but weaker growth and an ECB pivot could pull the pair back toward 1.13 and potentially 1.10.
Author  Mitrade
Dec 26, 2025
With the ECB likely holding rates steady at 2.15% and the Fed potentially extending cuts into 2026, EUR/USD may test 1.20 if Eurozone growth proves resilient, but weaker growth and an ECB pivot could pull the pair back toward 1.13 and potentially 1.10.
placeholder
My Top 5 Stock Market Predictions for 2026Five 2026 market predictions written in a native, news-style voice: AI’s winners and losers, broader sector leadership, dividend demand, valuation cooling as the Shiller CAPE sits at 39 (Dec. 31, 2025), and quantum-computing bursts—while keeping all original facts and numbers unchanged.
Author  Mitrade
Jan 06, Tue
Five 2026 market predictions written in a native, news-style voice: AI’s winners and losers, broader sector leadership, dividend demand, valuation cooling as the Shiller CAPE sits at 39 (Dec. 31, 2025), and quantum-computing bursts—while keeping all original facts and numbers unchanged.
placeholder
Gold Price Forecast: XAU/USD keeps looking for direction above $4,500Gold (XAU/USD) trades lower for the second consecutive day on Friday, but remains contained within previous ranges, with downside attempts limited above the $4,500 line for now.
Author  FXStreet
May 22, Fri
Gold (XAU/USD) trades lower for the second consecutive day on Friday, but remains contained within previous ranges, with downside attempts limited above the $4,500 line for now.
placeholder
Gold declines to near $4,500 as renewed US‑Iran tensions, Fed tightening bets weighGold price (XAU/USD) loses ground to around $4,500 during the early Asian session on Wednesday. The precious metal extends the decline as fresh US military strikes on Iran dimmed hopes of a peace deal and reinforced concerns that persistent inflation could keep interest rates higher for longer. 
Author  FXStreet
Yesterday 01: 26
Gold price (XAU/USD) loses ground to around $4,500 during the early Asian session on Wednesday. The precious metal extends the decline as fresh US military strikes on Iran dimmed hopes of a peace deal and reinforced concerns that persistent inflation could keep interest rates higher for longer. 
placeholder
Gold flatlines near $4,450 on US-Iran uncertainties, US PCE inflation data loomsGold price (XAU/USD) trades on a flat note around $4,455 during the early Asian session on Thursday. The precious metal steadies as US-Iran peace negotiations face uncertainties.
Author  FXStreet
13 hours ago
Gold price (XAU/USD) trades on a flat note around $4,455 during the early Asian session on Thursday. The precious metal steadies as US-Iran peace negotiations face uncertainties.
goTop
quote