


VYM vs. VYMI: Which Vanguard Dividend ETF Is a Better Buy?
Key Points
The Vanguard International High Dividend Yield ETF has outperformed its U.S. counterpart for the past five years, with 13.2% annualized returns.
The Vanguard High Dividend Yield ETF only holds about 600 U.S. stocks, with one major tech name accounting for 8% of the fund.
The Vanguard International High Dividend Yield ETF offers a higher dividend yield and lower price to earnings (P/E) ratio than its U.S. counterpart.
- 10 stocks we like better than Vanguard International High Dividend Yield ETF ›
Dividend stocks can be a good choice for a few situations and investment strategies. If you're feeling nervous about high valuations of tech stocks, want to diversify into other parts of the market after recent run-ups in share prices, or want to earn more income from your stocks, buying dividend ETFs can quickly put more dividend-paying companies in your portfolio.
Two popular Vanguard ETFs offer a broad range of high-yield dividend stocks. One fund, the Vanguard High Dividend Yield ETF (NYSEMKT: VYM), is focused on U.S. stocks, while the other ETF, the Vanguard International High Dividend Yield ETF (NASDAQ: VYMI), focuses on international stocks. For the past five years, the international fund has outperformed the U.S. fund, but both have underperformed the S&P 500 index.
Will AI create the world's first trillionaire? Our team just released a report on the one little-known company, called an "Indispensable Monopoly" providing the critical technology Nvidia and Intel both need. Continue »
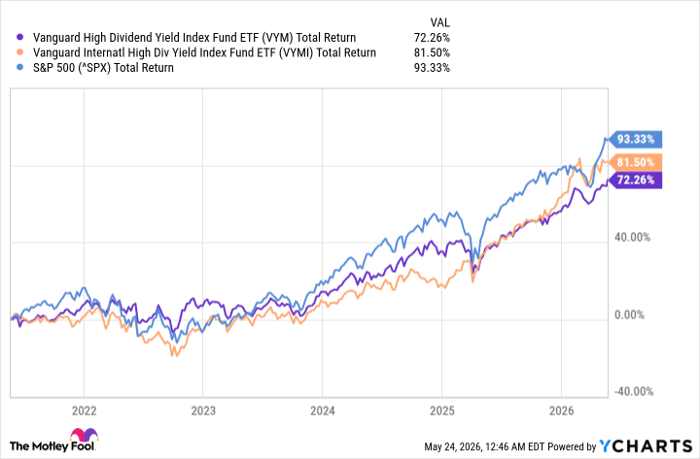
VYM Total Return Level data by YCharts
If your goal is to beat the market, these dividend ETFs might not be the right choice. But if you want steady dividends from reliable, consistently profitable companies, each of these two dividend stock funds is worth a look.
Here are more details on which of these Vanguard ETFs could be a better buy.

Image source: Getty Images.
Vanguard High Dividend Yield ETF: Five years of 11.9% annualized returns
The Vanguard High Dividend Yield ETF holds 608 stocks that are forecast to deliver above-average dividends. It has delivered average annual returns (by net asset value) of 11.9% over the past five years, 17% over the past three years, and 29.5% in the past year. Its dividend yield of 2.24% is competitive with the best dividend ETFs.
The Vanguard High Dividend Yield ETF gives you exposure to a wide range of sectors. Top sector holdings include financials (20.2% of the fund), technology (14.8%), industrials (14.2%), healthcare (11.8%), and energy stocks (9.7%).
The top five stock holdings in this dividend fund are:
- Broadcom (8.03% of the fund)
- JPMorgan Chase (3.3%)
- ExxonMobil (2.7%)
- Johnson & Johnson (2.3%)
- Caterpillar (1.7%)
One note of caution with the Vanguard High Dividend Yield ETF is that it's a little top-heavy with Broadcom. That one semiconductor stock makes up about 8% of the fund. If your goal for buying dividend ETFs is to get away from tech-heavy parts of the stock market, this fund might not be a perfect fit.
But VYM has some good points in its favor. This is a low-cost Vanguard ETF, with an expense ratio of only 0.04%. And its trailing 12-month price to earnings (P/E) ratio is 21.42, which is much lower than the S&P 500 index's P/E ratio of 32.19. This fund could be cheap compared to the rest of the U.S. stock market.
Vanguard International High Dividend Yield ETF: Five years of 13.2% annualized returns
The Vanguard International High Dividend Yield ETF gives you exposure to 1,582 stocks outside the U.S., representing 45 countries (as of April 30). This fund has delivered average annual returns (by net asset value) of 13.2% over the past five years, 21.04% over the past three years, and 35.7% in the past year.
Top countries included in this ETF are Japan and the United Kingdom (each making up 11.3% of the fund), Canada (8.9%), Australia and Switzerland (7.4% each), with China at 6.4%. This international ETF holds stocks from developed markets like Europe and the Pacific and emerging markets (which make up 22.4% of the fund).
Compared to the Vanguard High Dividend Yield ETF, this international fund is more diversified. No single stock makes up more than 1.7% of the portfolio. And none of the top 10 stock holdings are major tech names. Instead, the top 10 stocks in the Vanguard International High Dividend Yield ETF include financial stocks, pharmaceutical stocks, and energy stocks, along with some well-known brand names like Nestlé and Toyota Motor.
The Vanguard International High Dividend Yield ETF has delivered higher dividends, with a yield of 3.47%. Its expense ratio is slightly higher at 0.07%, but still quite low-cost. And its P/E ratio of 14.24 is even lower than the U.S. fund -- high-yield dividend stocks in other countries might still be undervalued compared to the U.S. stock market.
Why buy VYMI instead of VYM?
Both Vanguard ETFs offer good reasons to buy, but if I had to choose one, I would go with the Vanguard International High Dividend Yield ETF. This international fund is more diversified, with more than 1,500 stocks instead of only 608, and it pays higher dividends with a lower P/E ratio.
Compared to U.S. dividend stocks, I believe international stocks offer greater upside potential. If you want to invest in reliably profitable companies that are different from the U.S. tech-heavy stock indexes, the Vanguard International High Dividend Yield ETF could be a good fit for that goal. And if the U.S. dollar weakens over the next few years, international stocks will gain value in dollar terms.
Should you buy stock in Vanguard International High Dividend Yield ETF right now?
Before you buy stock in Vanguard International High Dividend Yield ETF, consider this:
The Motley Fool Stock Advisor analyst team just identified what they believe are the 10 best stocks for investors to buy now… and Vanguard International High Dividend Yield ETF wasn’t one of them. The 10 stocks that made the cut could produce monster returns in the coming years.
Consider when Netflix made this list on December 17, 2004... if you invested $1,000 at the time of our recommendation, you’d have $477,813!* Or when Nvidia made this list on April 15, 2005... if you invested $1,000 at the time of our recommendation, you’d have $1,320,088!*
Now, it’s worth noting Stock Advisor’s total average return is 986% — a market-crushing outperformance compared to 208% for the S&P 500. Don't miss the latest top 10 list, available with Stock Advisor, and join an investing community built by individual investors for individual investors.
See the 10 stocks »
*Stock Advisor returns as of May 26, 2026.
JPMorgan Chase is an advertising partner of Motley Fool Money. Ben Gran has no position in any of the stocks mentioned. The Motley Fool has positions in and recommends Broadcom, Caterpillar, JPMorgan Chase, and Vanguard High Dividend Yield ETF. The Motley Fool recommends Johnson & Johnson and Nestlé. The Motley Fool has a disclosure policy.
Recommended Articles


