
The Stock Market Is Sounding a Dire Warning for 2026 -- but Are Investors Paying Attention?
Key Points
The Dow Jones Industrial Average, S&P 500, and Nasdaq Composite have enjoyed another phenomenal year, with these major indexes respectively climbing by 13% to 20% year-to-date.
Two of Wall Street's time-tested forecasting tools -- one of which has been back-tested 155 years -- portend trouble for stocks in the new year.
Leaning on time and perspective can turn short-term pain on Wall Street into a generational investment opportunity for long-term investors.
- 10 stocks we like better than S&P 500 Index ›
With less than two weeks to go before we ring in the new year, investors have every reason to smile. Despite a volatile spring in which President Donald Trump unveiled his tariff and trade policy, the ageless Dow Jones Industrial Average (DJINDICES: ^DJI), benchmark S&P 500 (SNPINDEX: ^GSPC), and growth stock-dominated Nasdaq Composite (NASDAQINDEX: ^IXIC) have rallied by 13%, 16%, and 20%, respectively, as of the closing bell on Dec. 16.
The list of catalysts for Wall Street has been lengthy, with an assortment of hyped trends driving investor euphoria. This includes the rise of artificial intelligence (AI), the emergence of quantum computing, excitement surrounding stock splits, and the proliferation of the Bitcoin treasury strategy.
Where to invest $1,000 right now? Our analyst team just revealed what they believe are the 10 best stocks to buy right now, when you join Stock Advisor. See the stocks »
Additionally, investors are looking forward to the impact of the Federal Reserve lowering interest rates. Making borrowing less costly for businesses can lead to an uptick in hiring, acquisitions, and spending on innovation.

Image source: Getty Images.
Although it would appear as if the stock market picked up right where it left off during President Trump's first term, a couple of historically surefire metrics are sounding a dire warning of what may come. The question is, are investors paying attention?
The stock market is pushing boundaries in all the wrong ways
To preface the following discussion, there isn't a predictive tool that can guarantee short-term directional movements for the Dow Jones, S&P 500, and Nasdaq Composite. If any surefire forecasting tool did exist, you could rest assured that everyone (professional and everyday investors alike) would be using it.
There are, however, an assortment of metrics and events that have strongly correlated with directional moves in the stock market's major indexes throughout history. It's a couple of these events that have signaled a dire warning for Wall Street in 2026.
The first comes courtesy of the S&P 500's Shiller Price-to-Earnings (P/E) Ratio, which is also referred to as the cyclically adjusted P/E Ratio, or CAPE Ratio. Whereas the traditional P/E ratio looks back on trailing 12-month earnings per share (EPS), the Shiller P/E is based on inflation-adjusted EPS over the trailing decade. Examining 10 years' worth of inflation-adjusted EPS history provides the closest thing to an apples-to-apples valuation comparison of Wall Street's most-followed stock index (the S&P 500) as investors will get.
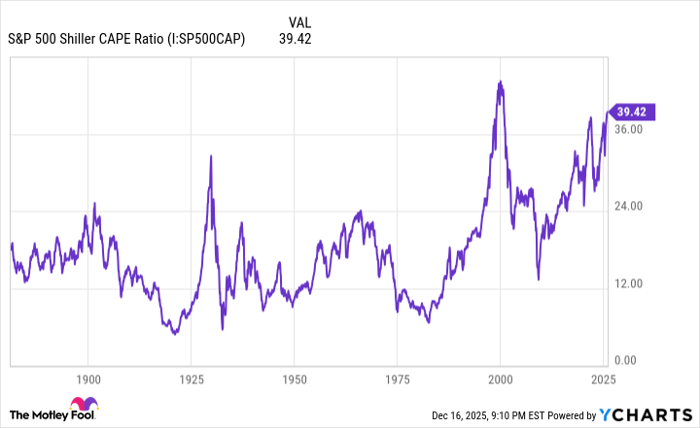
S&P 500 Shiller CAPE Ratio data by YCharts.
When back-tested 155 years, the S&P 500's Shiller P/E has averaged a multiple of approximately 17.3. But as you'll likely note from the chart, the CAPE Ratio has spent much of the last 30 years above this 155-year average. This reflects the internet breaking down information barriers between Wall Street and Main Street in the mid-1990s, and lower interest rates fueling investors' appetite for potentially riskier growth stocks.
As of the closing bell on Dec. 16, the Shiller P/E clocked in with a multiple of 40.04. It's the second priciest the stock market has ever been, based on this time-tested valuation tool.
The previous five instances (since January 1871) where the S&P 500's Shiller P/E surpassed 30 and held this multiple for at least two months were eventually (keyword!) followed by declines in one or more of Wall Street's major stock indexes of 20% to 89%. In other words, the Shiller P/E makes clear that premium stock valuations aren't tolerated over extended periods.
The other predictive metric that tells a similar story is one that the Oracle of Omaha, billionaire Warren Buffett, has embraced: the market cap-to-GDP ratio.
Warren Buffett Indicator hits a new all-time high of 223%, the most expensive stock market valuation in history 🚨🚨 pic.twitter.com/p14CI3VXGu
-- Barchart (@Barchart) October 26, 2025
In a 2001 interview with Fortune magazine, Buffett referred to this ratio as "probably the best single measure of where valuations stand at any given moment." It's arrived at by adding up the cumulative value of publicly traded companies in the U.S. and dividing this figure by U.S. gross domestic product (GDP).
Since 1970, this ratio, now affably known as the Buffett indicator, has averaged 85%. This is to say that the aggregate value of public companies has, on average, equaled 85% of U.S. GDP. On Dec. 10, the Buffett indicator hit an all-time high of 226.26%.
While the Buffett indicator can't pinpoint precisely when the music will stop on Wall Street, it does have a flawless track record of foreshadowing big declines for the Dow Jones Industrial Average, S&P 500, and Nasdaq Composite. Significant moves beyond its historical mean have, eventually, all given way to bear market declines.

Image source: Getty Images.
Time and perspective are Wall Street's silver linings
Based solely on historical correlations associated with the Shiller P/E and Buffett indicator, there's a heightened probability of a stock market correction, bear market, or perhaps even a short-lived crash in 2026. It's certainly not a rosy forecast considering the strength that the S&P 500's bull market has exhibited over the last three years.
However, there's a silver lining mixed into this dire warning for investors, and it has everything to do with time and perspective.
To state the obvious, double-digit percentage downturns in the stock market are an inevitability on Wall Street. Moves lower in equities are often driven, in part, by emotions, which no amount of fiscal or monetary policy can counter. Consider stock market corrections, bear markets, and crash events as the price of admission to one of the world's greatest wealth creators.
But this is where time and perspective come into play. If investors take a step back and look at the stock market's boom-and-bust cycles, they'll note how disproportionate they've been over the last century.
In June 2023, shortly after the S&P 500 was confirmed to be in a new bull market, the analysts at Bespoke Investment Group published a data set on X (formerly Twitter) that calculated the calendar-day length of every bull and bear market in the benchmark index dating back to the start of the Great Depression in September 1929.
It's official. A new bull market is confirmed.
-- Bespoke (@bespokeinvest) June 8, 2023
The S&P 500 is now up 20% from its 10/12/22 closing low. The prior bear market saw the index fall 25.4% over 282 days.
Read more at https://t.co/H4p1RcpfIn. pic.twitter.com/tnRz1wdonp
Bespoke examined 27 separate bear market declines in the S&P 500 spanning almost 94 years. Researchers found the average S&P 500 bear market resolved in just 286 calendar days, or less than 10 months. Furthermore, only eight out of 27 bear markets reached the one-year mark, and none lasted more than 630 calendar days.
At the other end of the spectrum, Bespoke uncovered an average S&P 500 bull market length of 1,011 calendar days, which is roughly 3.5 times longer than the typical bear market. If the current bull market is extrapolated to the present day, it would mark the 14th of 27 S&P 500 bull markets that have lasted longer than the lengthiest bear market.
In other words, staying the course and pouncing on price dislocations during short-lived downturns has paid off handsomely for long-term investors who maintain perspective. If these dire warnings prove accurate for 2026, short-term pain can be turned into a generational investment opportunity.
Should you buy stock in S&P 500 Index right now?
Before you buy stock in S&P 500 Index, consider this:
The Motley Fool Stock Advisor analyst team just identified what they believe are the 10 best stocks for investors to buy now… and S&P 500 Index wasn’t one of them. The 10 stocks that made the cut could produce monster returns in the coming years.
Consider when Netflix made this list on December 17, 2004... if you invested $1,000 at the time of our recommendation, you’d have $506,935!* Or when Nvidia made this list on April 15, 2005... if you invested $1,000 at the time of our recommendation, you’d have $1,067,514!*
Now, it’s worth noting Stock Advisor’s total average return is 958% — a market-crushing outperformance compared to 192% for the S&P 500. Don't miss the latest top 10 list, available with Stock Advisor, and join an investing community built by individual investors for individual investors.
See the 10 stocks »
*Stock Advisor returns as of December 20, 2025.
Sean Williams has no position in any of the stocks mentioned. The Motley Fool has positions in and recommends Bitcoin. The Motley Fool has a disclosure policy.
Recommended Articles


