
The Stock Market Just Did Something It Hasn't Done in 18 Years. Is It a Signal or Noise?
Key Points
After closing at a high of 6,890.89 on Oct. 28, the S&P 500 has since fallen 5.1%
The index is trading below its 50-day moving average for the first time in nearly six months.
The S&P 500 still looks unusually expensive based on the CAPE ratio.
- 10 stocks we like better than S&P 500 Index ›
The stock market has been on a wild ride over the past three years.
Following the public release of ChatGPT, tech stocks have soared with the Nasdaq Composite more than doubling from its 2022 nadir. The S&P 500 (SNPINDEX: ^GSPC) has been on a tear as well.
Where to invest $1,000 right now? Our analyst team just revealed what they believe are the 10 best stocks to buy right now, when you join Stock Advisor. See the stocks »
The broad-market index jumped 24% in 2023 and gained another 23% in 2024. With just a few weeks left in the year, the S&P 500 appears to be on track for another double-digit gain.
However, there are signs the raging bull market is suffering from fatigue. After a remarkable recovery from the crash that followed the Liberation Day tariffs announcement in April, stocks had marched steadily higher until a recent pullback on fears of an AI bubble. Weak macroeconomic signals, including flatlining job growth, declining consumer sentiment and discretionary spending, and an increase in auto loan delinquencies, have only added to investors' unease.
The S&P 500 hit a closing high of 6,890.89 on Oct. 28, but it has pulled back 5.1% as of Nov. 20. As a result, the index fell below its 50-day moving average for the first time since April 30, marking its fifth-longest streak since 1950.
The following chart shows the S&P 500's gains during that period, when it gained nearly 20%:
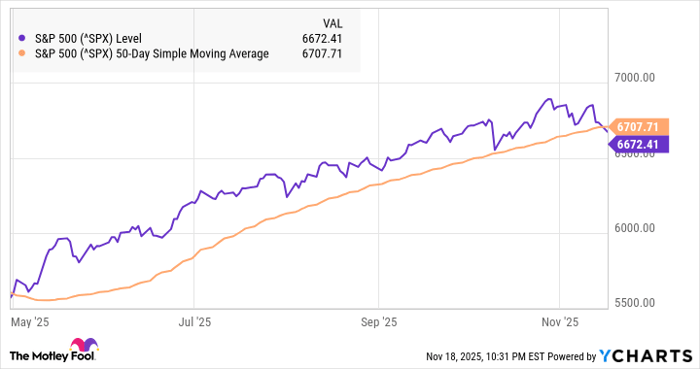
Data by YCharts.
The rally shows investors have largely been confident and bullish despite the volatile macroeconomic environment.
How it compares to history
That streak, which lasted 198 days, was the longest the S&P 500 has traded above its 50-day moving average since 2007.
Three other times since then, the S&P 500 has had similar streaks where it traded above its 50-day moving average for 150 days or more. Two of those occurred in the bull market of the previous decade, from Nov. 2016 to Apr. 2017 and from Aug. 2017 to Feb. 2018. In the current bull market, there was a streak of 162 days from Nov. 2023 to Apr. 2024.
Given the market jitters right now, you might expect the end of this latest streak would portend a bear market, or at least a correction, but that hasn't been the case historically. Instead, the stock market has generally continued to march higher in the months following such bullish periods. Based on the the prior three streaks, the S&P 500 was up an average of 8% in the subsequent six months.
Of the top 15 streaks since 1950, the biggest crash that followed came after the streak that ended in 2007, which preceded the financial crisis. However, that streak ended in Feb. 2007, months before the market actually peaked in Oct. 2007.

Image source: Getty Images.
What it means for investors
Given the history of these moving-average streaks, the end of this latest one doesn't seem all that worrying. If anything, history suggests additional near-term gains are in store for the S&P 500.
However, that's not the only market signal investors should be paying attention to. The Shiller P/E ratio, also known as the CAPE ratio, which is like the price-to-earnings ratio but takes into account the past 10 years of earnings, is at its second highest level in history. The only other time it was higher was on the eve of the bursting of the dot-com bubble.
That's not a sign the stock market is about to crash either, but there's no single indicator that investors need to pay attention to. The best way to get a sense of where the market might be headed and the current risk/reward picture is to consider a broad set of factors, including valuation, trends, and macro-level indicators.
Given the S&P 500's high valuation and the uncertainty in the economy, investors should at least expect more volatility ahead. But the market's long streak trading above its 50-day moving average (and the end of that streak) isn't a reason to be overly alarmed.
Should you invest $1,000 in S&P 500 Index right now?
Before you buy stock in S&P 500 Index, consider this:
The Motley Fool Stock Advisor analyst team just identified what they believe are the 10 best stocks for investors to buy now… and S&P 500 Index wasn’t one of them. The 10 stocks that made the cut could produce monster returns in the coming years.
Consider when Netflix made this list on December 17, 2004... if you invested $1,000 at the time of our recommendation, you’d have $593,222!* Or when Nvidia made this list on April 15, 2005... if you invested $1,000 at the time of our recommendation, you’d have $1,143,342!*
Now, it’s worth noting Stock Advisor’s total average return is 1,013% — a market-crushing outperformance compared to 188% for the S&P 500. Don’t miss out on the latest top 10 list, available when you join Stock Advisor.
See the 10 stocks »
*Stock Advisor returns as of November 17, 2025
Jeremy Bowman has no position in any of the stocks mentioned. The Motley Fool has no position in any of the stocks mentioned. The Motley Fool has a disclosure policy.
Recommended Articles


