

April NFP Lands at 8:30 AM Today — 65K Forecast, a New Fed Chair, and the Dollar at Triple-Bottom Support
TradingKey - April 2026 NFP forecast 62K–70K vs March 178K. Unemployment expected 4.3%. Fed on hold at 3.50–3.75% with Kevin Warsh as new chair. DXY triple-bottom at $97.69. Trade setup inside.
The April 2026 nonfarm payrolls report is due in at 8:30 AM ET today, May 9th. And right now theres a pretty big consensus building around 62,000 to 70,000 jobs - which is way off the strong 178,000 that came in for March and is actually the softest forecast in a few months. Just to put it into perspective, March was a bit of an outlier thanks to the healthcare sector bouncing back from a strike - 76,000 of those March jobs came from healthcare, so April's numbers will be interesting to see in comparison.
The unemployment rate is expected to hold steady at 4.3% meanwhile average hourly earnings are forecast to climb 0.3% month to month, or 3.8% year over year, which will be worth keeping an eye on especially given the fact that inflation is still a bit of a worry thanks to rising oil prices.
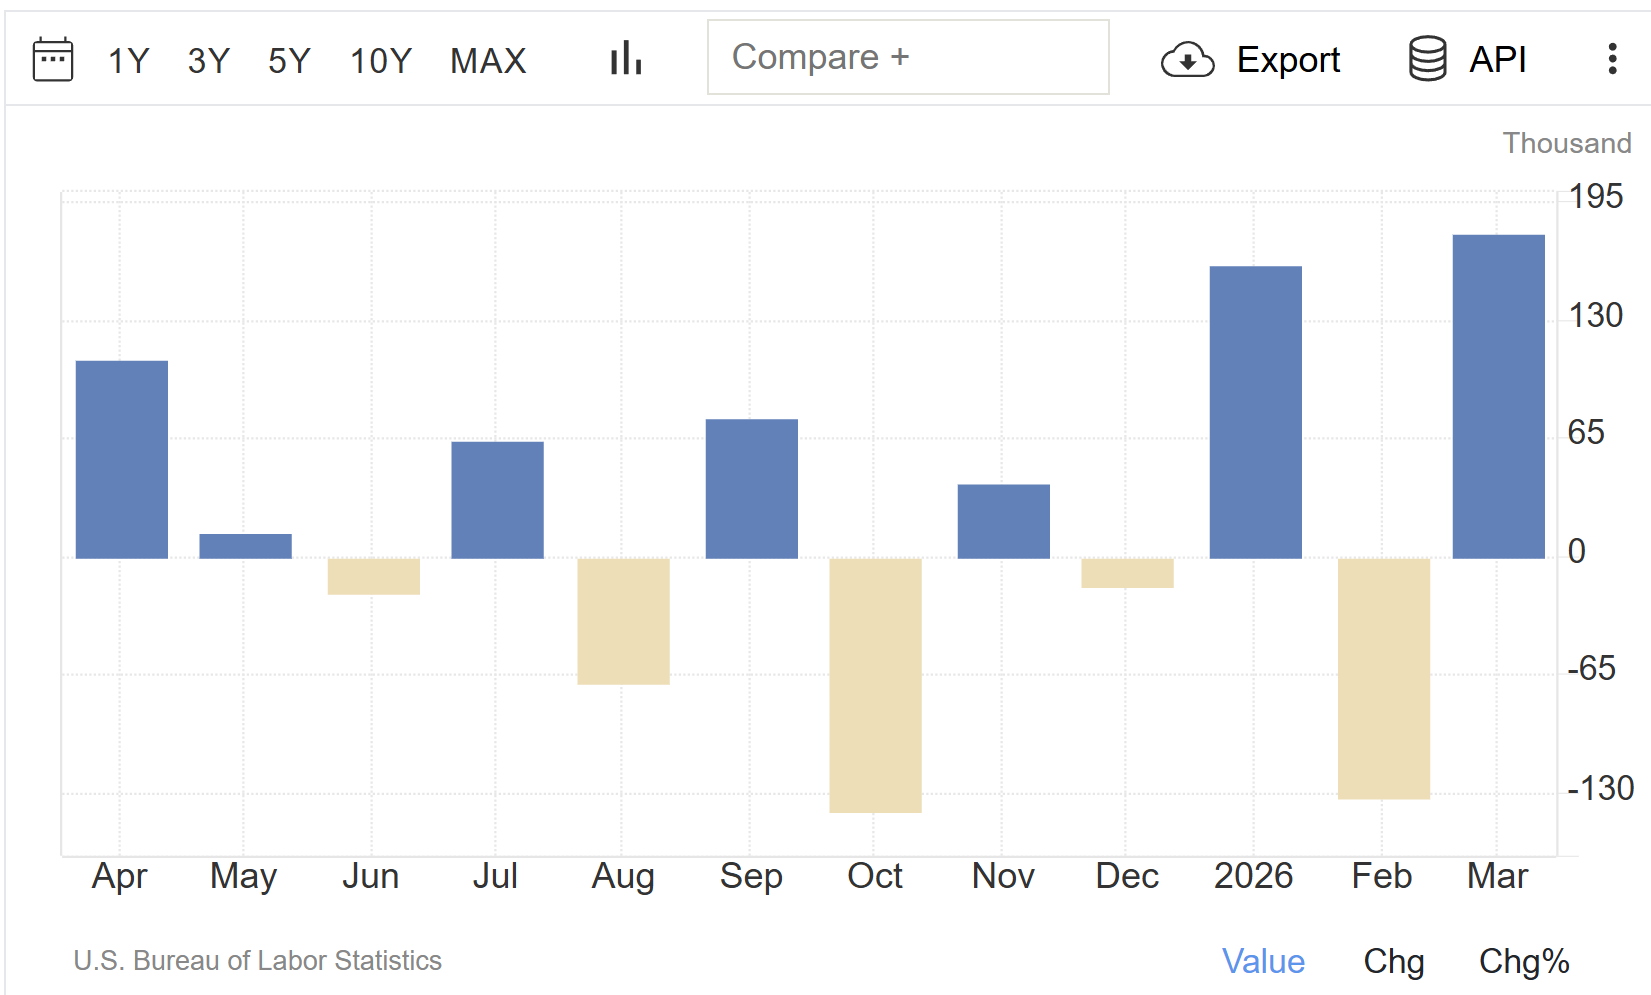
Source: U.S. Bureau of Labor Statistics
The Fed meanwhile is sticking with interest rates between 3.50 & 3.75% - and with Kevin Warsh now at the helm as chair, it looks like rate cuts are off the table for the immediate future. And it's worth noting that the dollar is holding up surprisingly well at the moment sitting at the triple bottom support level around $97.69 to $98.25 - but today's numbers will either start to look pretty grim or they'll validate that dollar floor.
What the 65K consensus actually means — and why revisions matter as much as the headline
That 178,000 print for March was an absolute outlier - and it was driven mainly by the healthcare sector (I mean 76,000 of those jobs came from doctors and nurses getting back to work after strikes). That being said, April is looking a lot more normal - and the consensus of 62,000 to 70,000 is probably a better indicator of whats going on in the labour market.
We've also got to keep in mind that since the end of 2025, the BLS has been making changes to the way they calculate the numbers - and that's caused some pretty wild swings in the monthly figures that have made the three month average a way more reliable indicator of whats really going on.
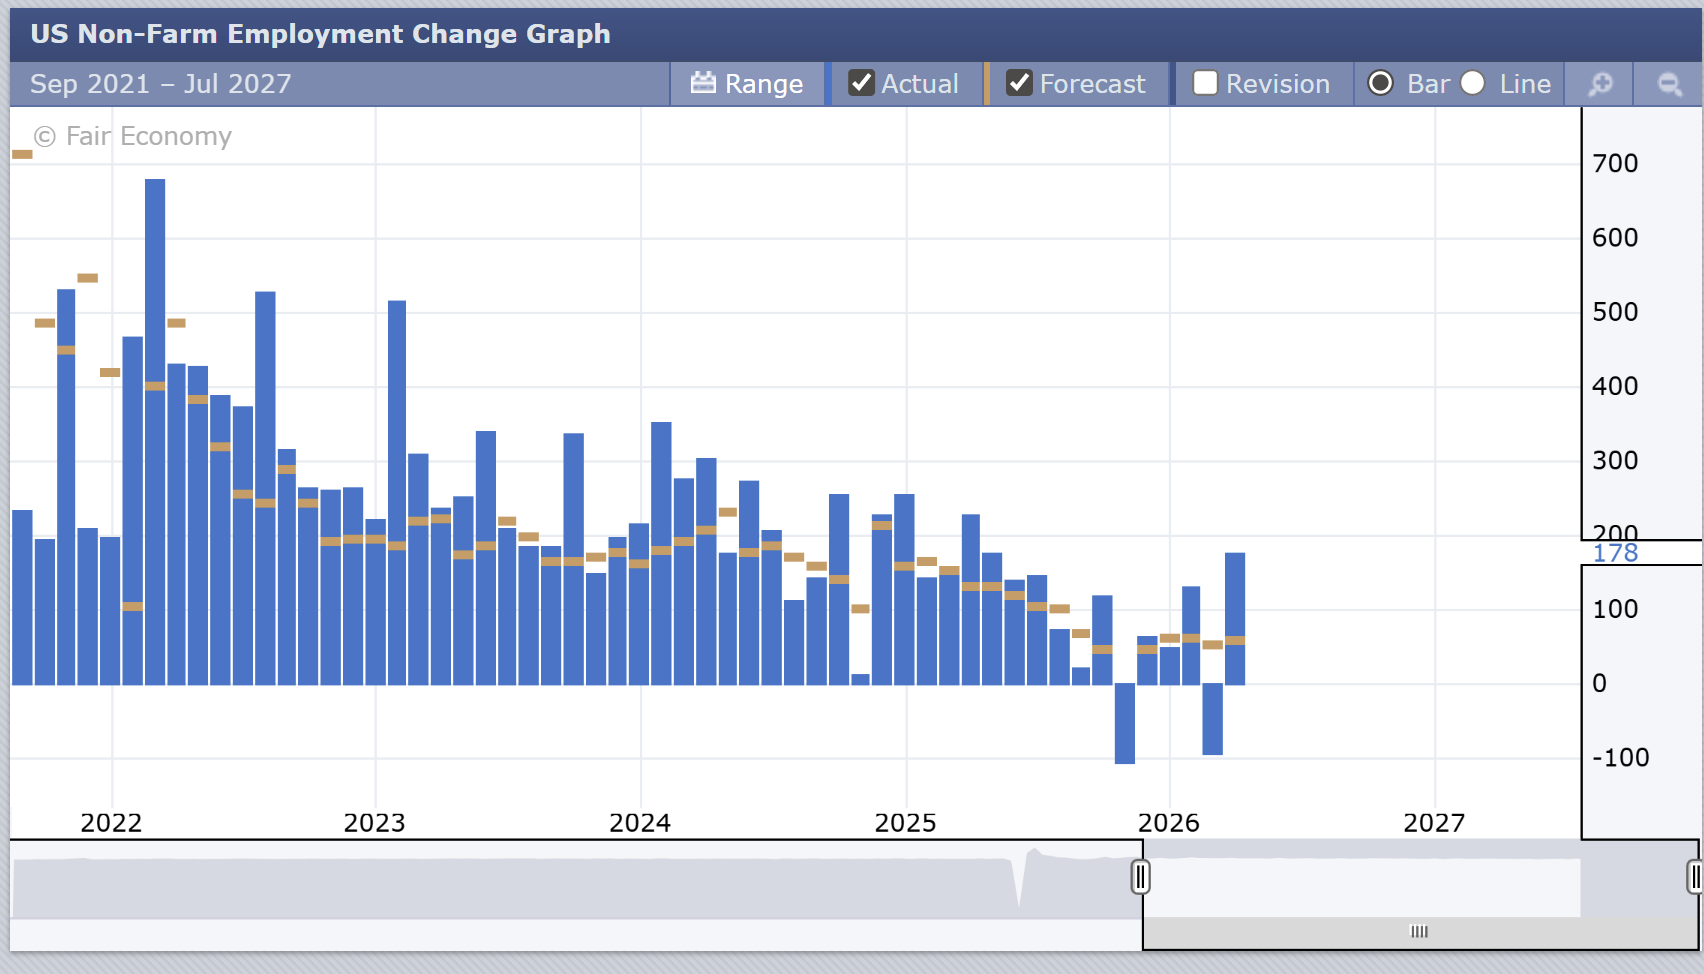
Source: Forexfactory
Two things are worth keeping an eye on today - the revision to Marchs numbers (those 178,000 jobs havnt been revised out yet, so that will be worth watching), and the average hourly earnings - if that comes in at 4.0% or higher it would look pretty good for the Fed - but on the other hand a print below 30,000 jobs would be a bad sign and could even force the Fed to rethink their stance on rate cuts. Of course a print above 100,000 would be a real beat, and could push the cut expectation back to 2027.
How the Fed and markets are positioned — cuts are not the base case right now
The stage is set for a pretty complicated macro picture for today's jobs report, to be honest. The Fed didn't change rates back in April 29, keeping them stuck at 3.50 to 3.75% - and that was no small decision either, with four of them voting against, the most we've seen since 1992. Then we've got a June 17 meeting just around the corner where Kevin Warsh will be taking over as chair.
At the moment, the CME is putting the odds of rate stays at an impressive 70% right through to the end of 2026 - but not without some chance of a hike that's edging its way up, with a small 17% chance on the table - and still only a 13% chance of one of those dreaded rate cuts. Reality is cuts aren't even within the realm of possibility for the time being - that's mainly down to Iran - ongoing tensions in the middle East are sending energy prices right back up and re-introducing some nasty inflation risks that are basically putting the kibosh on the Fed cutting rates - even if the labour market does start to soften.
According to Bank of America, unless the jobs number comes out at 50,000 or below, we can forget about even the slightest whisper of a rate cut for May or June. The bar for the Fed to get all dovish today is pretty low: we just need to see some pretty poor numbers - a weak headline wages aren't looking too hot, and no upward revision to last month.
How Each Scenario Affects Stocks, Gold, and the Dollar
The reaction framework is skewered to one side because of how the market stands right now. If there's a softer-than-expected print - or one that comes in a bit below the consensus - things look a bit different: the dollar gets a bit of a hit, gold sees a bit of a lift as inflation expectations get trimmed back a bit, and growth stocks and the Nasdaq do okay out of a dovish tone even though the market barely budges off expectations of rate-cutting.
On the flip side, if the numbers really tank and come in below 30,000 - the dollar takes a hit that gets worse fast, gold goes up some more, and suddenly people start thinking again about rate cuts coming in by the end of the year. On the other hand, if the numbers blow past consensus and come in well above 100,000, the dollar comes roaring back - CME numbers show the DXY is already pushing pretty hard against technical support so a better-than-expected print could end up triggering a bit of a mad dash to buy into the dollar. Tech stocks tied to high growth and gold are likely to get knocked around as investors start to think that interest rates need to stay high for a while. China's central bank has a big buying program that provides a sort of safety net for gold - which means even if the numbers beat expectations, the price of gold might pull back a bit in the short term.
DXY technical analysis — triple-bottom at $97.69 with positive divergence
The Dollar Index is at $98.10, looking to test the upper boundary of that triple-bottom support zone between $97.69 and $98.25 on the 4H chart - again. It's been stuck inside a pretty clear falling channel since the highs in February at around $101, with the dollar's purple moving average acting like a bit of a speed bump at $99.25 - $99.68 every time price tries to make a move.
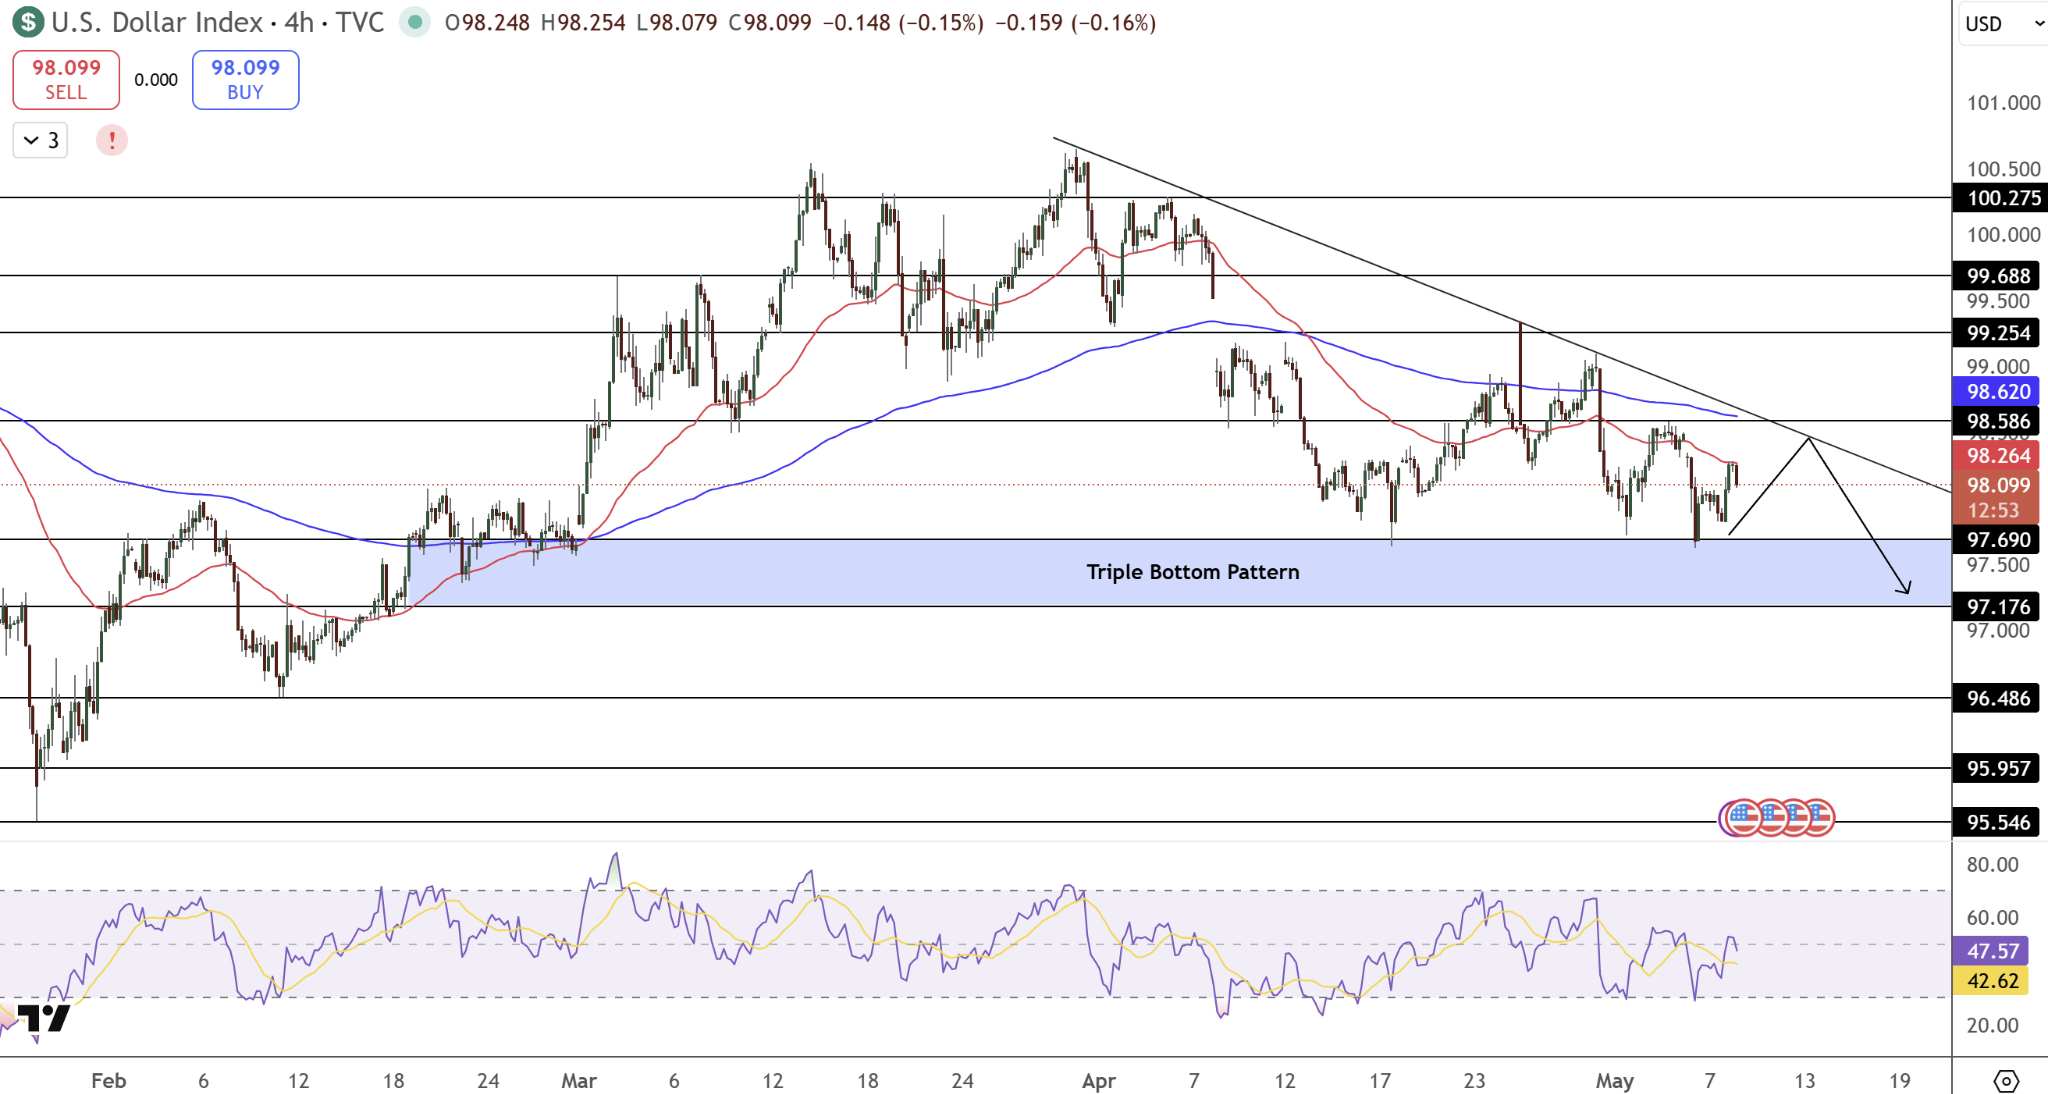
The momentum indicator is hovering around 42 to 47, but there is a bit of a +ve divergence on the May lows to think about - which is just saying that the rate of decline is slowing down. If the NFP numbers out today come in softer than expected, then it's possible we might see a break below that $97.69 floor - which would open the door to a run down to $97.18. On the other hand, a surprisingly hot beat could be all we need to bounce the dollar back up above $98.50 and start heading up towards $99.25 - $99.68.
Dollar Index (DXY) Trade Setup
Long Trade: Come on board if the dollar can push past $98.50 on a beat - that would give it a go at $99.25 and then $99.68
Short Opportunity: If we see a break below $97.69 on a miss, then that opens up the possibility of heading down to $97.18
Wait and See Zone: $97.69 - $98.50 - not much happening here, so let's just wait for a bit more confirmation before committing
Stop Loss (Long Position): You'll want to bail if the dollar slips beneath $97.69 - at which point the triple bottom support has failed
The Bottom Line
April NFP is due to drop in a market where interest rate cuts are far from a done deal , and the inflation worries sparked by the Iran conflict are having the fed stuck in a holding pattern under new chief Kevin Warsh. The forecast of 65K jobs created is already pretty much baked in to prices, but it's the really big numbers that could get the market's attention. A total collapse to below 30K and suddenly people might start to think cuts are back on the table - or, conversely, a massive beat of 100K or more could send the dollar soaring as people scramble to cover their bets. As it stands with the dollar down at $98.10- its sitting on the triple bottom line of support & has some positive divergence on its chart - all of which points to a good chance of a rally above $98.50 if the numbers are strong, but if they're a shocker then $97.69 below might be the place to short the dollar. Next up will be the CPI numbers on Wednesday, which will be yet another big macro event that'll help shape the fed's mind come June 17 under the new leadership of Warsh.
Recommended Articles


